OPEN-SOURCE SCRIPT
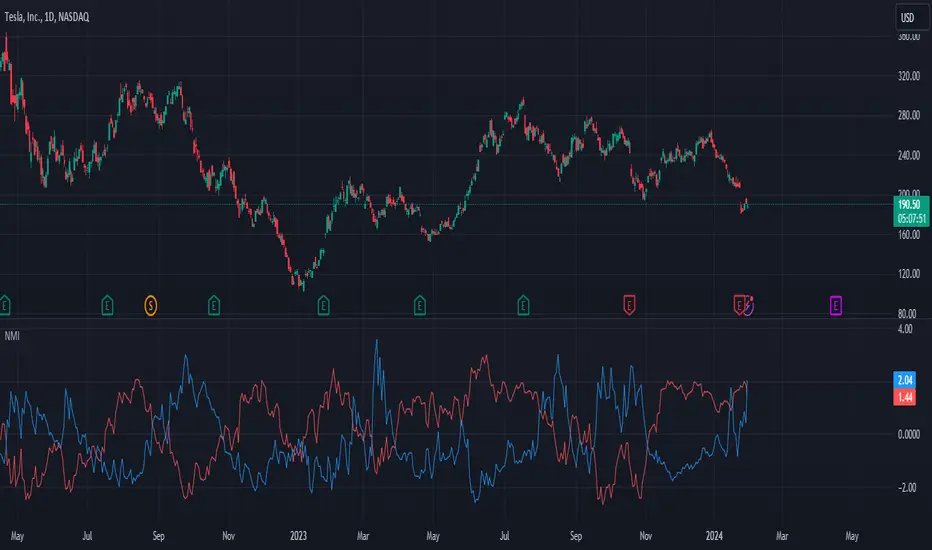
Normalized Market Indicators
Explanation of the Code:
Data Retrieval: The script retrieves the closing prices of the S&P 500 (sp500) and VIX (vix).
Normalization: The script normalizes these values using a simple z-score normalization (subtracting the 50-period simple moving average and dividing by the 50-period standard deviation). This makes the scales of the two datasets more comparable.
Plotting with Secondary Axis: The normalized values of the S&P 500 and VIX are plotted on the same chart. They will share the same y-axis scale as the main chart (e.g. Netflix, GOLD, Forex).
Points to Note:
Normalization Method: The method of normalization (z-score in this case) is a choice and can be adjusted based on your needs. The idea is to bring the data to a comparable scale.
Timeframe and Symbol Codes: Ensure the timeframe and symbol codes are appropriate for your data source and trading strategy.
Overlaying on Price Chart: Since these values are normalized and plotted on a seperate chart, they won't directly correspond to the price levels of the main chart (e.g. Netflix, GOLD, Forex).
Open-source Skript
Ganz im Sinne von TradingView hat dieser Autor sein/ihr Script als Open-Source veröffentlicht. Auf diese Weise können nun auch andere Trader das Script rezensieren und die Funktionalität überprüfen. Vielen Dank an den Autor! Sie können das Script kostenlos verwenden, aber eine Wiederveröffentlichung des Codes unterliegt unseren Hausregeln.
Haftungsausschluss
Die Informationen und Veröffentlichungen sind nicht als Finanz-, Anlage-, Handels- oder andere Arten von Ratschlägen oder Empfehlungen gedacht, die von TradingView bereitgestellt oder gebilligt werden, und stellen diese nicht dar. Lesen Sie mehr in den Nutzungsbedingungen.