OPEN-SOURCE SCRIPT
Ehlers Early Onset Trend
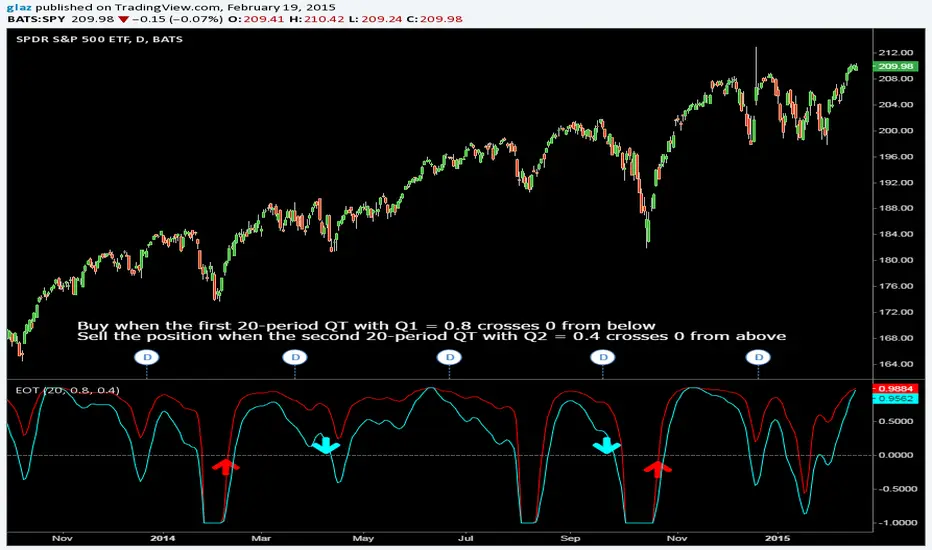
In his article in this issue, “The Quotient Transform,” author John Ehlers introduces the quotient transform (QT), a zero-lag filter that can be used for the purpose of timely trend detection. The QT is an advancement of the technique he presented in his January 2014 S&C article, “Predictive And Successful Indicators.” This time, the output of a roofing filter (which includes applying a high-pass filter and SuperSmoother filter) is normalized.
Code and other platforms traders.com/documentation/feedbk_docs/2014/08/TradersTips.html
Pinescript code Glaz and LazyBear
Code and other platforms traders.com/documentation/feedbk_docs/2014/08/TradersTips.html
Pinescript code Glaz and LazyBear
Open-source Skript
Ganz im Sinne von TradingView hat dieser Autor sein/ihr Script als Open-Source veröffentlicht. Auf diese Weise können nun auch andere Trader das Script rezensieren und die Funktionalität überprüfen. Vielen Dank an den Autor! Sie können das Script kostenlos verwenden, aber eine Wiederveröffentlichung des Codes unterliegt unseren Hausregeln.
Haftungsausschluss
Die Informationen und Veröffentlichungen sind nicht als Finanz-, Anlage-, Handels- oder andere Arten von Ratschlägen oder Empfehlungen gedacht, die von TradingView bereitgestellt oder gebilligt werden, und stellen diese nicht dar. Lesen Sie mehr in den Nutzungsbedingungen.