OPEN-SOURCE SCRIPT
Custom Date Markers
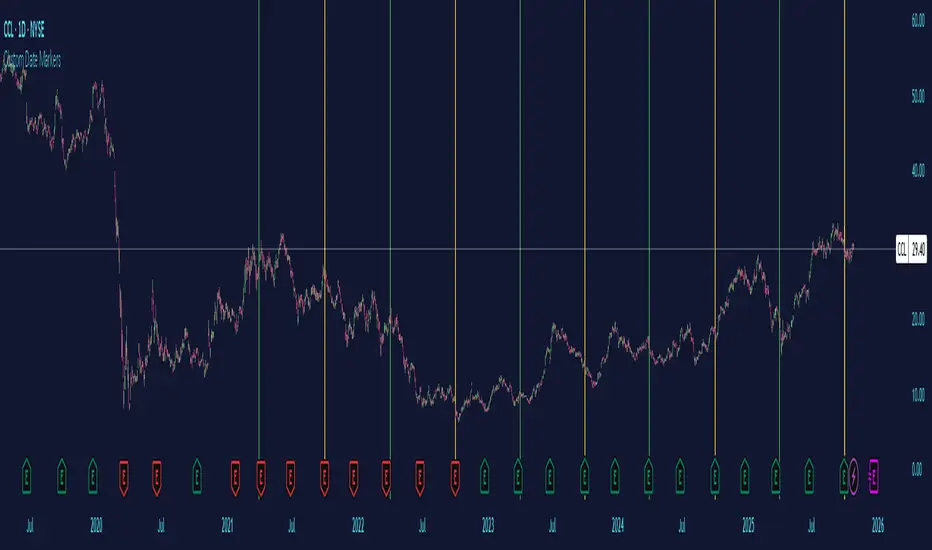
Custom Date Markers - Pine Script Indicator
This indicator provides a powerful visual tool for technical and pattern analysis by allowing traders to mark up to 10 specific historical dates with customizable vertical lines on any chart. Each date can be assigned its own unique color, making it easy to categorize and distinguish between different types of events or market catalysts.
Primary Use Cases:
The indicator excels at identifying cyclical patterns and recurring market behavior. By marking significant dates such as earnings announcements, Federal Reserve meetings, dividend ex-dates, or seasonal events, traders can quickly visualize whether stocks consistently react in similar ways around these recurring dates. This is particularly valuable for discovering hidden patterns that might not be obvious from price action alone.
Practical Applications:
Earnings Analysis: Mark historical earnings dates to see if a stock tends to rally or sell-off before/after announcements
Macro Events: Identify how assets respond to FOMC meetings, CPI releases, or other economic data
Seasonal Patterns: Track dates that show recurring volatility or directional moves (like tax deadline periods, end-of-quarter re balancing, etc.)
Event Studies: Analyze the impact of company-specific events like product launches, FDA approvals, or leadership changes
Advanced Insights:
What makes this tool particularly interesting is its ability to reveal non-obvious correlations. For example, you might discover that a retail stock consistently experiences volume spikes 2-3 weeks before Black Friday across multiple years, or that certain tech stocks show weakness during specific conference dates. The color-coding feature allows you to layer multiple event types simultaneously—perhaps using red for bearish catalysts and green for bullish ones—creating a visual heat map of historical market reactions.
The indicator's 6-month default spacing (covering 4.5 years) is strategically designed to capture multiple business cycles while maintaining clarity on the chart. This timeframe is long enough to identify genuine patterns rather than coincidences, yet focused enough to remain relevant to current market conditions.
Pro Tip: Combine this indicator with volume analysis or other technical indicators to validate whether the patterns you observe are accompanied by meaningful market participation or if they're statistical noise.
Open-source Skript
Ganz im Sinne von TradingView hat dieser Autor sein/ihr Script als Open-Source veröffentlicht. Auf diese Weise können nun auch andere Trader das Script rezensieren und die Funktionalität überprüfen. Vielen Dank an den Autor! Sie können das Script kostenlos verwenden, aber eine Wiederveröffentlichung des Codes unterliegt unseren Hausregeln.
Haftungsausschluss
Die Informationen und Veröffentlichungen sind nicht als Finanz-, Anlage-, Handels- oder andere Arten von Ratschlägen oder Empfehlungen gedacht, die von TradingView bereitgestellt oder gebilligt werden, und stellen diese nicht dar. Lesen Sie mehr in den Nutzungsbedingungen.