OPEN-SOURCE SCRIPT
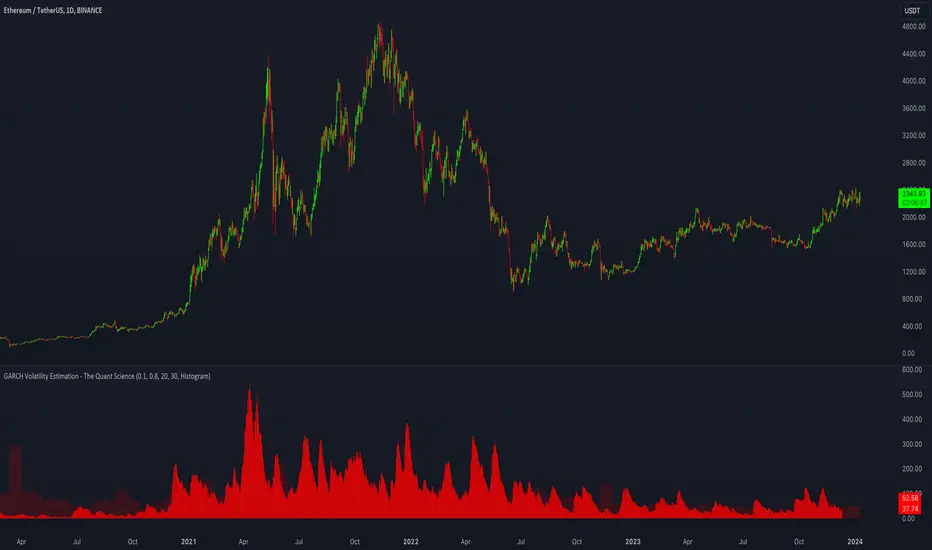
GARCH Volatility Estimation - The Quant Science
The GARCH (Generalized Autoregressive Conditional Heteroskedasticity) model is a statistical model used to forecast the volatility of a financial asset. This model takes into account the fluctuations in volatility over time, recognizing that volatility can vary in a heteroskedastic (i.e., non-constant variance) manner and can be influenced by past events.
https://www.tradingview.com/x/mv51UwTa/
The general formula of the GARCH model is:
σ²(t) = ω + α * ε²(t-1) + β * σ²(t-1)
where:
σ²(t) is the conditional variance at time t (i.e., squared volatility)
ω is the constant term (intercept) representing the baseline level of volatility
α is the coefficient representing the impact of the squared lagged error term on the conditional variance
ε²(t-1) is the squared lagged error term at the previous time period
β is the coefficient representing the impact of the lagged conditional variance on the current conditional variance
In the context of financial forecasting, the GARCH model is used to estimate the future volatility of the asset.
HOW TO USE
This quantitative indicator is capable of estimating the probable future movements of volatility. When the GARCH increases in value, it means that the volatility of the asset will likely increase as well, and vice versa. The indicator displays the relationship of the GARCH (bright red) with the trend of historical volatility (dark red).
USER INTERFACE
Alpha: select the starting value of Alpha (default value is 0.10).
https://www.tradingview.com/x/UjMJo6B8/
Beta:select the starting value of Beta (default value is 0.80).
https://www.tradingview.com/x/jwI4Uwhx/
Lenght: select the period for calculating values within the model such as EMA (Exponential Moving Average) and Historical Volatility (default set to 20).
https://www.tradingview.com/x/NxFJ8y9z/
Forecasting: select the forecasting period, the number of bars you want to visualize data ahead (default set to 30).
https://www.tradingview.com/x/tNvgvxzB/
Design: customize the indicator with your preferred color and choose from different types of charts, managing the design settings.
https://www.tradingview.com/x/T833Fyzv/
Open-source Skript
Ganz im Sinne von TradingView hat dieser Autor sein/ihr Script als Open-Source veröffentlicht. Auf diese Weise können nun auch andere Trader das Script rezensieren und die Funktionalität überprüfen. Vielen Dank an den Autor! Sie können das Script kostenlos verwenden, aber eine Wiederveröffentlichung des Codes unterliegt unseren Hausregeln.
Haftungsausschluss
Die Informationen und Veröffentlichungen sind nicht als Finanz-, Anlage-, Handels- oder andere Arten von Ratschlägen oder Empfehlungen gedacht, die von TradingView bereitgestellt oder gebilligt werden, und stellen diese nicht dar. Lesen Sie mehr in den Nutzungsbedingungen.