OPEN-SOURCE SCRIPT
Aktualisiert High Volume Price Levels x3
This script detects recent huge volume areas to help you finding out good support and resistance levels.
For each of the3 periods (defaults : 100, 200, 500) a new line will be drawn from the last time the volume amount exceeded n% (default 99%) of the highest volume on the same period, to the next occurence.
Most of time, these lines represent strong support and resistance levels which can be helpful in your technical analysis.
Options:
Notes:
* Sometimes, the last detected level from every periods can be the same at the same moment. In this situation, you'll only see one or two of the lines instead of three.
* I'd like to figure out how to continuously draw every interesting levels without making the chart unreadable. Of course this script will be updated if I find a good way to do it.
* Feel free to suggest any improvements/modifications.
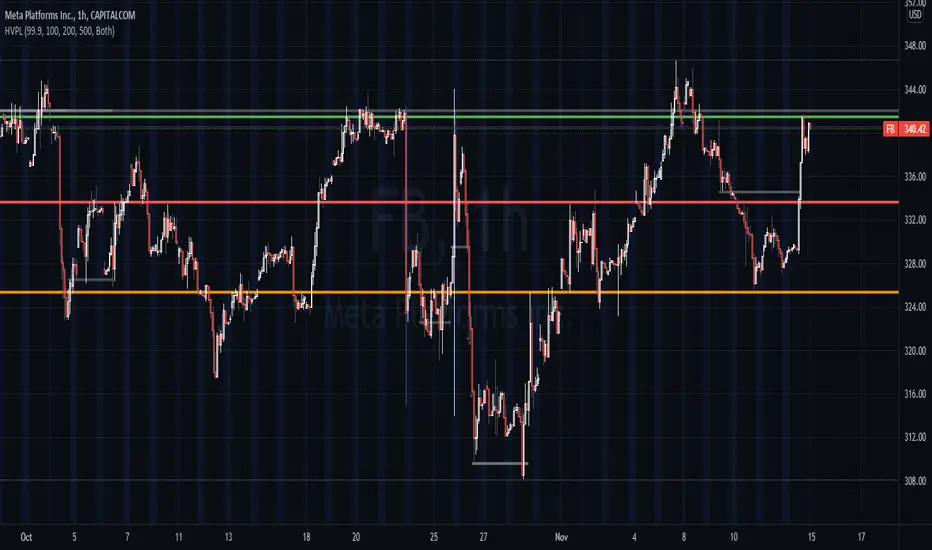
Example:

For each of the3 periods (defaults : 100, 200, 500) a new line will be drawn from the last time the volume amount exceeded n% (default 99%) of the highest volume on the same period, to the next occurence.
Most of time, these lines represent strong support and resistance levels which can be helpful in your technical analysis.
Options:
- Volume trigger level: represents the minimum % of the highest volume within the given period on which you want to draw a new price level. (But higher this % is, stronger the levels will be)
- Periods: The reference periods for high volume detection.
- Show period: Enable/Disable the use of any period.
- Period Color: Select a color correspondig to each period.
- Show current levels only: Disable drawing of previous levels, to display current levels only.
- Extend last level: Extend current lines to right/left/both or none sides of your chart.
Notes:
* Sometimes, the last detected level from every periods can be the same at the same moment. In this situation, you'll only see one or two of the lines instead of three.
* I'd like to figure out how to continuously draw every interesting levels without making the chart unreadable. Of course this script will be updated if I find a good way to do it.
* Feel free to suggest any improvements/modifications.
Example:
Versionshinweise
Demo chart updated. Previous levels drawnVersionshinweise
- Corrected mistyped short title
- A "Ghost lines" option that extend 3rd period price lines has been added (activated by default)
- Previous levels are now colored in gray
Versionshinweise
Fix wrong operator in the previous update 1min (ago)Versionshinweise
fix: old lines corresponding to 3rd price level still in red instead of gray when ghost lines are disabledVersionshinweise
fix: tiny display bug for period1 linefix: removing useless empty lines
fix: any line width is now fixed to 3
Open-source Skript
Ganz im Sinne von TradingView hat dieser Autor sein/ihr Script als Open-Source veröffentlicht. Auf diese Weise können nun auch andere Trader das Script rezensieren und die Funktionalität überprüfen. Vielen Dank an den Autor! Sie können das Script kostenlos verwenden, aber eine Wiederveröffentlichung des Codes unterliegt unseren Hausregeln.
Haftungsausschluss
Die Informationen und Veröffentlichungen sind nicht als Finanz-, Anlage-, Handels- oder andere Arten von Ratschlägen oder Empfehlungen gedacht, die von TradingView bereitgestellt oder gebilligt werden, und stellen diese nicht dar. Lesen Sie mehr in den Nutzungsbedingungen.