OPEN-SOURCE SCRIPT
Correlation Analysis Tool
📈 What Does It Do?
🔍 How It Works
⚙️ Features
🧩 How to Use
🚨 Limitations
💡 Best Ways To Use
📜 Disclaimer
This script is for educational and informational purposes only. Please conduct your own research and consult with a financial advisor before making investment decisions. The author is not responsible for any losses or damages resulting from the use of this script.
- Correlation Calculation: Measures the correlation between a selected asset (Asset 1) and up to four additional assets (Asset 2, Asset 3, Asset 4, Asset 5).
- User Inputs: Allows you to define the primary asset and up to four comparison assets, as well as the period for correlation calculations.
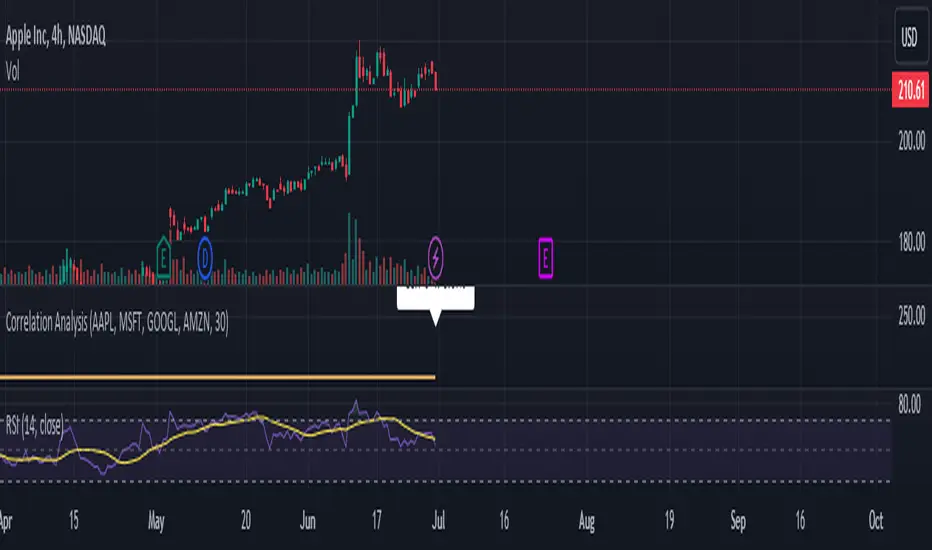
- Correlation Matrix: Displays a matrix of correlation coefficients as a text label on the chart.
🔍 How It Works
- Inputs: Enter the symbols for Asset 1 (main asset) and up to four other assets for comparison.
- Correlation Period: Specify the period over which the correlations are calculated.
- Calculations: Computes log returns for each asset and calculates the correlation coefficients.
- Display: Shows a textual correlation matrix at the top of the chart with percentage values.
⚙️ Features
- Customizable Assets: Input symbols for one primary asset and up to four other assets.
- Flexible Period: Choose the period for correlation calculation.
- Correlation Coefficients: Outputs correlation values for all asset pairs.
- Textual Correlation Matrix: Provides a correlation matrix with percentage values for quick reference.
🧩 How to Use
- Add the Script: Apply the script to any asset’s chart.
- Set Asset Symbols: Enter the symbols for Asset 1 and up to four other assets.
- Adjust Correlation Period: Define the period for which correlations are calculated.
- Review Results: Check the correlation matrix displayed on the chart for insights.
🚨 Limitations
- Historical Data Dependency: Correlations are based on historical data and might not reflect future market conditions.
- No Visual Plots Yet: This script does not include visual plots; it only provides a textual correlation matrix.
💡 Best Ways To Use
- Sector Comparison: Compare assets within the same sector or industry for trend analysis.
- Diversification Analysis: Use the correlations to understand how different assets might diversify or overlap in your portfolio.
- Strategic Decision Making: Utilize correlation data for making informed investment decisions and portfolio adjustments.
📜 Disclaimer
This script is for educational and informational purposes only. Please conduct your own research and consult with a financial advisor before making investment decisions. The author is not responsible for any losses or damages resulting from the use of this script.
Open-source Skript
Ganz im Sinne von TradingView hat dieser Autor sein/ihr Script als Open-Source veröffentlicht. Auf diese Weise können nun auch andere Trader das Script rezensieren und die Funktionalität überprüfen. Vielen Dank an den Autor! Sie können das Script kostenlos verwenden, aber eine Wiederveröffentlichung des Codes unterliegt unseren Hausregeln.
Haftungsausschluss
Die Informationen und Veröffentlichungen sind nicht als Finanz-, Anlage-, Handels- oder andere Arten von Ratschlägen oder Empfehlungen gedacht, die von TradingView bereitgestellt oder gebilligt werden, und stellen diese nicht dar. Lesen Sie mehr in den Nutzungsbedingungen.