OPEN-SOURCE SCRIPT
Aktualisiert Multi‑Timeframe RSIOMA Dashboard
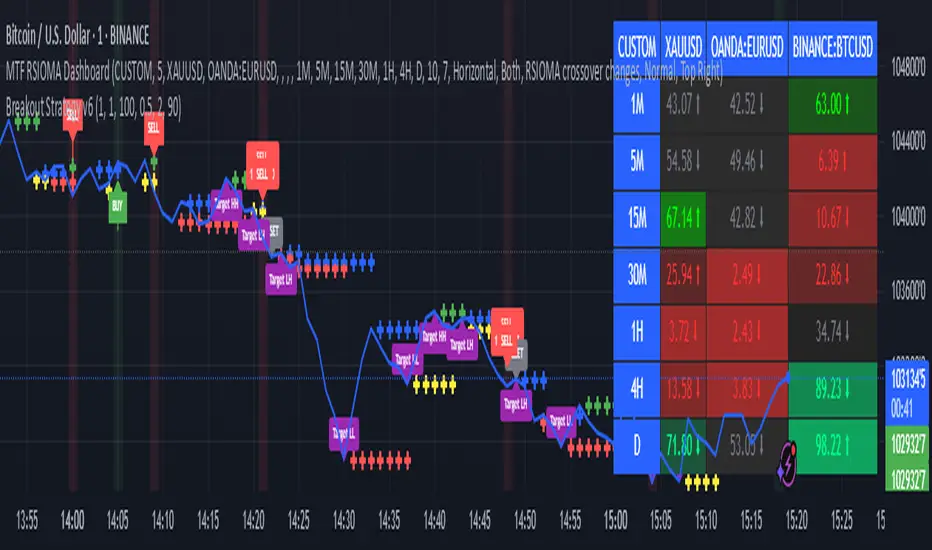
The Multi-Timeframe RSIOMA Dashboard is a TradingView tool that displays RSIOMA (Relative Strength Index Over Moving Average) values for up to 10 symbols across multiple timeframes in a color-coded table. It helps traders spot bullish (>50, green) or bearish (<50, red) momentum, with optional MA smoothing for clearer trends. Customize symbols, timeframes, and settings to track market strength at a glanc
Versionshinweise
UPDATE Versionshinweise
UPDATEVersionshinweise
UPDATEVersionshinweise
update Versionshinweise
updateVersionshinweise
UPDATEVersionshinweise
updateVersionshinweise
UPDATEVersionshinweise
update Versionshinweise
UPDATE Open-source Skript
Ganz im Sinne von TradingView hat dieser Autor sein/ihr Script als Open-Source veröffentlicht. Auf diese Weise können nun auch andere Trader das Script rezensieren und die Funktionalität überprüfen. Vielen Dank an den Autor! Sie können das Script kostenlos verwenden, aber eine Wiederveröffentlichung des Codes unterliegt unseren Hausregeln.
Haftungsausschluss
Die Informationen und Veröffentlichungen sind nicht als Finanz-, Anlage-, Handels- oder andere Arten von Ratschlägen oder Empfehlungen gedacht, die von TradingView bereitgestellt oder gebilligt werden, und stellen diese nicht dar. Lesen Sie mehr in den Nutzungsbedingungen.
Open-source Skript
Ganz im Sinne von TradingView hat dieser Autor sein/ihr Script als Open-Source veröffentlicht. Auf diese Weise können nun auch andere Trader das Script rezensieren und die Funktionalität überprüfen. Vielen Dank an den Autor! Sie können das Script kostenlos verwenden, aber eine Wiederveröffentlichung des Codes unterliegt unseren Hausregeln.
Haftungsausschluss
Die Informationen und Veröffentlichungen sind nicht als Finanz-, Anlage-, Handels- oder andere Arten von Ratschlägen oder Empfehlungen gedacht, die von TradingView bereitgestellt oder gebilligt werden, und stellen diese nicht dar. Lesen Sie mehr in den Nutzungsbedingungen.