OPEN-SOURCE SCRIPT
MFI Candles MTF Table

MFI Candles + Multi-Timeframe Table | by julzALGO
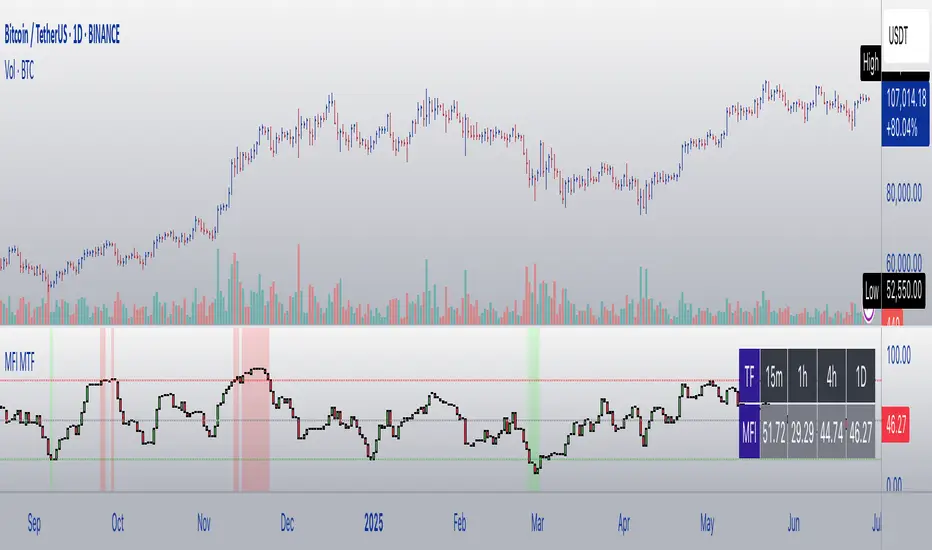
This open-source script visualizes the Money Flow Index (MFI) in a new format — as candles instead of a traditional oscillator line. It provides a clean, volume-driven view of momentum and pressure, ideal for traders seeking more actionable and visual cues than a typical MFI plot.
What Makes It Unique:
• Plots "MFI Candles" — synthetic candles based on smoothed MFI values using a selected timeframe (default: 1D), giving a new way to read volume flow.
• Candles reflect momentum: green if MFI rises, red if it falls.
• Background turns red when MFI is overbought (≥ 80) or green when oversold (≤ 20).
Multi-Timeframe Strength Table:
• Displays MFI values from 15m, 1h, 4h, and 1D timeframes — all in one dashboard.
• Color-coded for quick recognition: 🔴 Overbought, 🟢 Oversold.
• Values are smoothed with linear regression for better clarity.
Custom Settings:
• MFI calculation length
• Smoothing factor
• Candle source timeframe
• Toggle table and OB/OS background
How to Use:
- Use MFI Candles to monitor momentum shifts based on money flow.
- Use the Multi-Timeframe Table to identify when multiple timeframes align — helpful for timing entries and exits.
- Watch the background for extreme conditions (OB/OS) that may signal upcoming reversals or pressure exhaustion.
Happy Trading!
Open-source Skript
Ganz im Sinne von TradingView hat dieser Autor sein/ihr Script als Open-Source veröffentlicht. Auf diese Weise können nun auch andere Trader das Script rezensieren und die Funktionalität überprüfen. Vielen Dank an den Autor! Sie können das Script kostenlos verwenden, aber eine Wiederveröffentlichung des Codes unterliegt unseren Hausregeln.
Haftungsausschluss
Die Informationen und Veröffentlichungen sind nicht als Finanz-, Anlage-, Handels- oder andere Arten von Ratschlägen oder Empfehlungen gedacht, die von TradingView bereitgestellt oder gebilligt werden, und stellen diese nicht dar. Lesen Sie mehr in den Nutzungsbedingungen.