OPEN-SOURCE SCRIPT
Aktualisiert Rolling CAGR
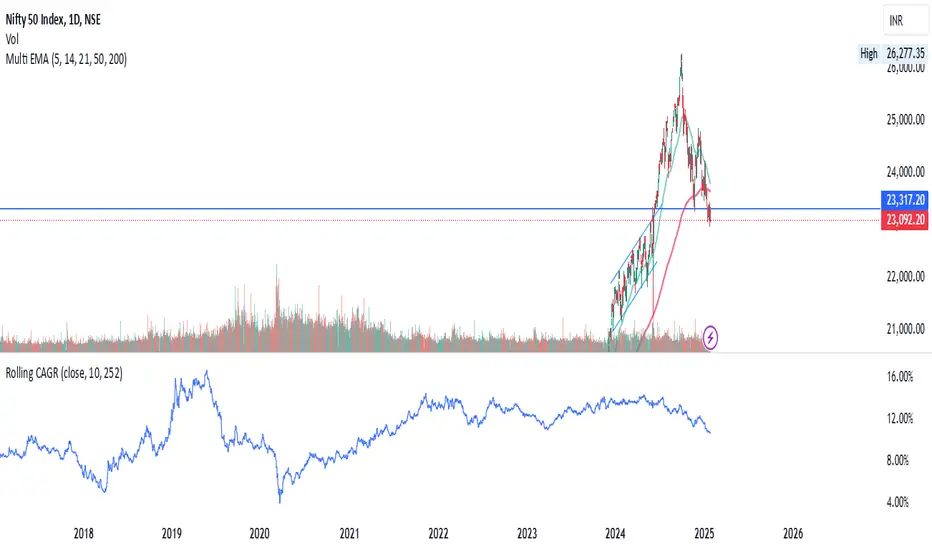
Rolling CAGR (Compound Annual Growth Rate) Indicator
This indicator calculates and plots the rolling Compound Annual Growth Rate (CAGR) for any selected data source. CAGR represents the mean annual growth rate of an investment over a specified time period, taking into account the effect of compounding.
Features:
• Customizable data source (default: close price)
• Adjustable time period in years
• Configurable trading days per year (252 for stocks, 365 for crypto)
• Results displayed as percentage values
• Works on daily timeframes
Input Parameters:
• Data Source: Select the price or indicator data to analyze
• Number of Years: Set the lookback period for CAGR calculation
• Trading Days in a Year: Adjust based on market type (252 for stocks, 365 for crypto)
Usage:
Perfect for analyzing long-term growth rates and comparing investment performance across different periods. The indicator provides a rolling view of compound growth, helping traders and investors understand the sustained growth rate of an asset over their chosen timeframe.
Note: This indicator is designed for daily timeframes as CAGR calculations are most meaningful over longer periods.
Formula Used:
CAGR = (End Value / Start Value)^(1/number of years) - 1
Versionshinweise
Rolling CAGR (Compound Annual Growth Rate) IndicatorThis indicator calculates and plots the rolling Compound Annual Growth Rate (CAGR) for any selected data source. CAGR represents the mean annual growth rate of an investment over a specified time period, taking into account the effect of compounding.
Features:
• Customizable data source (default: close price)
• Adjustable time period in years
• Configurable trading days per year (252 for stocks, 365 for crypto)
• Results displayed as percentage values
• Works on daily timeframes
Input Parameters:
• Data Source: Select the price or indicator data to analyze
• Number of Years: Set the lookback period for CAGR calculation
• Trading Days in a Year: Adjust based on market type (252 for stocks, 365 for crypto)
Usage:
Perfect for analyzing long-term growth rates and comparing investment performance across different periods. The indicator provides a rolling view of compound growth, helping traders and investors understand the sustained growth rate of an asset over their chosen timeframe.
Note: This indicator is designed for daily timeframes as CAGR calculations are most meaningful over longer periods.
Formula Used:
CAGR = (End Value / Start Value)^(1/number of years) - 1
Open-source Skript
Ganz im Sinne von TradingView hat dieser Autor sein/ihr Script als Open-Source veröffentlicht. Auf diese Weise können nun auch andere Trader das Script rezensieren und die Funktionalität überprüfen. Vielen Dank an den Autor! Sie können das Script kostenlos verwenden, aber eine Wiederveröffentlichung des Codes unterliegt unseren Hausregeln.
Haftungsausschluss
Die Informationen und Veröffentlichungen sind nicht als Finanz-, Anlage-, Handels- oder andere Arten von Ratschlägen oder Empfehlungen gedacht, die von TradingView bereitgestellt oder gebilligt werden, und stellen diese nicht dar. Lesen Sie mehr in den Nutzungsbedingungen.