OPEN-SOURCE SCRIPT
Directional Momentum Visualizer
Description
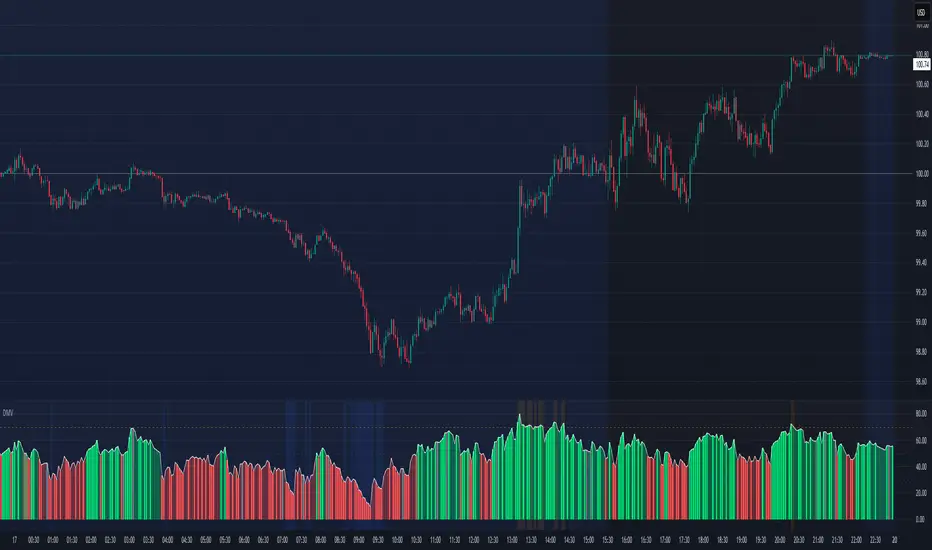
This script provides a color-coded column visualization of a classic momentum oscillator that measures relative strength and weakness. Instead of a single line, it uses conditional coloring to make directional changes easier to identify at a glance.
The tool is designed for clarity and adaptability, offering both column and line displays, with optional overbought, oversold, and midpoint guides.
How It Works
The script evaluates the oscillator’s value relative to a midpoint and its previous reading.
Depending on whether it’s above or below the midpoint — and whether it’s rising or falling — each column changes color:
This structure makes momentum shifts instantly visible without relying on line crossings or alerts.
Key Features
Inputs Overview
How to Use
How it Helps
This visual approach offers a clearer perspective on momentum dynamics by replacing the traditional single-line display with color-coded columns. The conditional coloring instantly reveals whether momentum is strengthening or weakening around a chosen midpoint, making trend shifts and fading pressure easier to interpret at a glance. It helps reduce visual noise and allows for quicker, more intuitive analysis of market behavior.
This tool is intended purely as a visual aid to help identify changing momentum conditions at a glance. It is not a buy or sell signal generator and should be used in combination with other forms of analysis and sound risk management.
⚠️ Disclaimer:
This script is provided for educational and informational purposes only. It is not financial advice and should not be considered a recommendation to buy, sell, or hold any financial instrument. Trading involves significant risk of loss and is not suitable for every investor. Users should perform their own due diligence and consult with a licensed financial advisor before making any trading decisions. The author does not guarantee any profits or results from using this script, and assumes no liability for any losses incurred. Use this script at your own risk.
This script provides a color-coded column visualization of a classic momentum oscillator that measures relative strength and weakness. Instead of a single line, it uses conditional coloring to make directional changes easier to identify at a glance.
The tool is designed for clarity and adaptability, offering both column and line displays, with optional overbought, oversold, and midpoint guides.
How It Works
The script evaluates the oscillator’s value relative to a midpoint and its previous reading.
Depending on whether it’s above or below the midpoint — and whether it’s rising or falling — each column changes color:
- Strong upward momentum (above midpoint and rising) → bright green
- Fading upward momentum (above midpoint but falling) → pale green
- Strong downward momentum (below midpoint and falling) → bright red
- Fading downward momentum (below midpoint but rising) → pale red
- Unchanged from the previous value → gray
This structure makes momentum shifts instantly visible without relying on line crossings or alerts.
Key Features
- Color-coded momentum columns for instant visual interpretation
- Adjustable midpoint, overbought, and oversold levels
- Optional line overlay for smoother reference
- Dynamic background highlighting in extreme zones
- Works on any symbol or timeframe
Inputs Overview
- Length: Controls the sensitivity of the oscillator calculation.
- Source: Selects the price source (Close, HL2, etc.).
- Midpoint Level: Defines the central reference level separating bullish and bearish momentum.
- Show Line: Toggles visibility of the traditional line overlay.
- Overbought / Oversold Levels: Define upper and lower boundaries for potential exhaustion zones.
How to Use
- Add the script to your chart from the Indicators tab.
- Adjust the midpoint and level settings to fit your preferred configuration.
- Observe how column colors shift to reflect strength or weakness in momentum.
- Use these transitions as visual context, not as trade signals.
How it Helps
This visual approach offers a clearer perspective on momentum dynamics by replacing the traditional single-line display with color-coded columns. The conditional coloring instantly reveals whether momentum is strengthening or weakening around a chosen midpoint, making trend shifts and fading pressure easier to interpret at a glance. It helps reduce visual noise and allows for quicker, more intuitive analysis of market behavior.
This tool is intended purely as a visual aid to help identify changing momentum conditions at a glance. It is not a buy or sell signal generator and should be used in combination with other forms of analysis and sound risk management.
⚠️ Disclaimer:
This script is provided for educational and informational purposes only. It is not financial advice and should not be considered a recommendation to buy, sell, or hold any financial instrument. Trading involves significant risk of loss and is not suitable for every investor. Users should perform their own due diligence and consult with a licensed financial advisor before making any trading decisions. The author does not guarantee any profits or results from using this script, and assumes no liability for any losses incurred. Use this script at your own risk.
Open-source Skript
Ganz im Sinne von TradingView hat dieser Autor sein/ihr Script als Open-Source veröffentlicht. Auf diese Weise können nun auch andere Trader das Script rezensieren und die Funktionalität überprüfen. Vielen Dank an den Autor! Sie können das Script kostenlos verwenden, aber eine Wiederveröffentlichung des Codes unterliegt unseren Hausregeln.
— IndicatorEliteFlow
No hype. Just data.
No hype. Just data.
Haftungsausschluss
Die Informationen und Veröffentlichungen sind nicht als Finanz-, Anlage-, Handels- oder andere Arten von Ratschlägen oder Empfehlungen gedacht, die von TradingView bereitgestellt oder gebilligt werden, und stellen diese nicht dar. Lesen Sie mehr in den Nutzungsbedingungen.