OPEN-SOURCE SCRIPT
Tomorrow Floor Pivots with CPR By Nifty Z
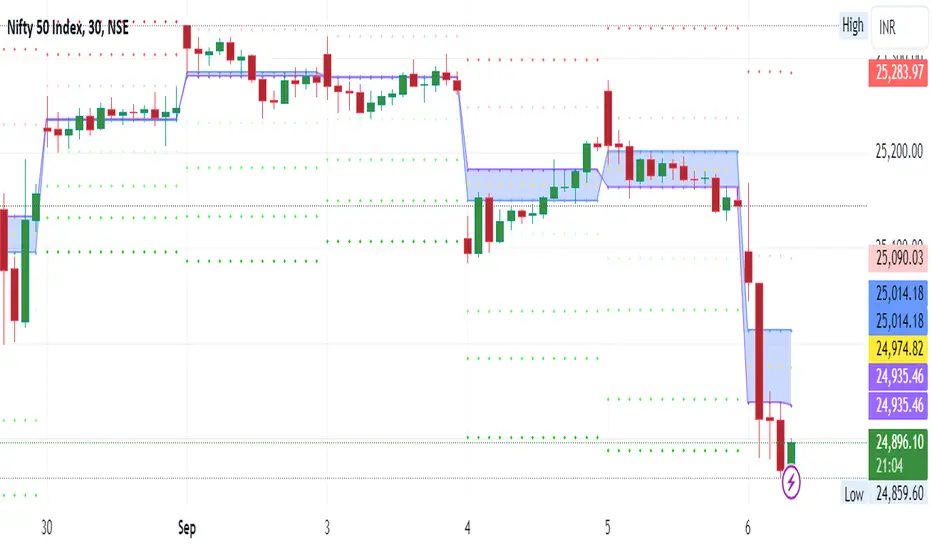
The colors for resistance and support levels have been updated to gradient reds and greens for clearer distinction.
The CPR band uses light blue and purple to stand out more effectively.
Here's a detailed explanation of the user inputs and the typical use of **Floor Pivots for Tomorrow’s Market Range** in a trading context, focusing on support, resistance, and breakout scenarios:
The script allows traders to customize key parameters for their analysis:
1. Pivot Timeframe:
- Users can select different timeframes for calculating floor pivots, such as 1 hour, 4 hours, daily, weekly, monthly, etc.
- This is crucial because the timeframe selection influences the granularity of the support and resistance levels for the next trading day.
- For instance, selecting a **Daily** timeframe will calculate floor pivots for the next trading day, while selecting **Weekly** will give levels for the upcoming week.
2. Show Floor Pivots:
- Users can toggle the visibility of the calculated **Floor Pivots**, which include resistance levels (R1, R2, R3, R4) and support levels (S1, S2, S3, S4).
3. Show CPR (Central Pivot Range):
- CPR (Central Pivot Range) is a key area where the price tends to consolidate.
- The script allows users to enable or disable the visibility of CPR, which consists of the BC (Bottom Central Pivot) and TC (Top Central Pivot).
4. Show Labels:
- Users can choose whether or not to display labels indicating the **Pivot**, **Support**, and Resistance levels on the chart. This can be helpful for visual analysis when day trading.
Understanding Floor Pivots
The Floor Pivots (Pivot, Resistance, and Support levels) for tomorrow's market range are calculated based on today’s high, low, and close. These levels help traders anticipate how the market may behave in the upcoming session.
1. Pivot:
- The Pivot Point is a central level, calculated as the average of the high, low, and close. It’s considered a reference point that determines the market’s overall bias.
- If the price is trading **above the pivot**, it generally suggests a **bullish** sentiment for the day.
- If the price is trading **below the pivot**, it suggests a **bearish** sentiment.
2. Resistance Levels (R1, R2, R3, R4):
- R1 is often the first area where price may stall in an uptrend. It represents the first major resistance level.
- **R2**, **R3**, and **R4** mark additional levels of resistance, progressively further away from the current price. These are used to project potential upward targets.
- These resistance levels are areas where the price might encounter selling pressure, especially during day trading.
3. **Support Levels (S1, S2, S3, S4):**
- Similarly, **S1** is the first area where the price might find support in a downtrend.
- **S2**, **S3**, and **S4** provide deeper support levels where the price may bounce from.
- These support zones are used by day traders to anticipate where the price might reverse upward.
### **Role of Resistance and Support in Day Trading**
- **Resistance Levels (R1, R2, R3, R4)** indicate potential areas where price could **stall** during an uptrend. These levels are useful for **short-term traders** looking to set exit points or identify reversal zones.
- **Support Levels (S1, S2, S3, S4)** highlight areas where the price could **find support** and potentially **bounce** higher. These levels are particularly helpful for identifying buy zones in a downtrend.
- If a price **breaks out** above the resistance levels or **breaks down** below the support levels, it often signals a strong trend continuation.
### **Understanding the Central Pivot Range (CPR)**
The **CPR** is formed by two key levels:
- **BC (Bottom Central Pivot):** The midpoint of the day’s high and low.
- **TC (Top Central Pivot):** The difference between the pivot and BC.
The CPR acts as a region of **consolidation** or **indecision** where the market is likely to stay within a narrow range. The width of the CPR gives traders a sense of volatility:
- A **narrow CPR** often signals that a **breakout** is imminent.
- A **wider CPR** suggests that the market could remain range-bound.
### **Market Sentiment Based on Floor Pivots**
The relationship between **today’s** and **tomorrow’s pivots** is crucial in determining the market sentiment for the next day.
1. **Bullish Case (Higher Highs):**
- If **tomorrow's pivot** is higher than **today's pivot**, it indicates a **bullish sentiment**. This suggests that the market is likely to trend upward in the next session.
- In a **bullish overlapping pivot range**, if **Day 1 (today)** is higher than **Day 2 (tomorrow)**, traders expect continued upward momentum.
2. **Bearish Case (Lower Lows):**
- Conversely, if **tomorrow's pivot** is lower than **today's pivot**, it suggests a **bearish sentiment** and that the market could trend downward in the next session.
- In a **bearish overlapping pivot range**, if **Day 1 (today)** is lower than **Day 2 (tomorrow)**, traders expect continued downward pressure.
### **Breakout Scenarios**
A breakout occurs when the price **violates either the support or resistance levels** significantly, indicating that the price is moving in the direction of the breakout.
1. **Bullish Breakout:**
- If the price consistently stays **above the CPR** and **resistance levels (R1, R2)**, it indicates a strong **bullish breakout**.
- This is especially true when the **CPR is narrow** for both days, signaling a buildup in price action and a potential breakout to the upside.
2. **Bearish Breakout:**
- If the price breaks **below the CPR** and **support levels (S1, S2)**, it indicates a **bearish breakout**.
- A narrow CPR on **both days** suggests that a breakout to the downside could be imminent.
3. **Neutral or Ranging Days:**
- Sometimes, the CPR stays **unchanged** for 4-5 days, indicating a period of **consolidation** where the price is moving within a tight range. This often leads to a significant breakout once the consolidation ends.
Strategic Application of Floor Pivots for Tomorrow
Traders use floor pivots to plan their next-day trades by:
- **Aligning with Market Sentiment:** Based on whether tomorrow’s pivot is higher or lower than today’s, traders can align their trades in the direction of the market’s overall bias.
- **Identifying Entry and Exit Points:** Resistance and support levels provide well-defined areas to enter or exit trades, making pivots essential for day trading strategies.
- **Anticipating Breakouts:** Monitoring the width of the CPR and the relation between pivots helps traders anticipate potential breakouts, allowing them to react quickly to sudden price movements.
By effectively using these pivots and understanding their significance, traders can improve their decision-making for short-term trades in the stock or futures markets.
Open-source Skript
Ganz im Sinne von TradingView hat dieser Autor sein/ihr Script als Open-Source veröffentlicht. Auf diese Weise können nun auch andere Trader das Script rezensieren und die Funktionalität überprüfen. Vielen Dank an den Autor! Sie können das Script kostenlos verwenden, aber eine Wiederveröffentlichung des Codes unterliegt unseren Hausregeln.
Haftungsausschluss
Die Informationen und Veröffentlichungen sind nicht als Finanz-, Anlage-, Handels- oder andere Arten von Ratschlägen oder Empfehlungen gedacht, die von TradingView bereitgestellt oder gebilligt werden, und stellen diese nicht dar. Lesen Sie mehr in den Nutzungsbedingungen.