OPEN-SOURCE SCRIPT
Aktualisiert Volume Support & Resistance multi timeframe [LM]
Hello guys,
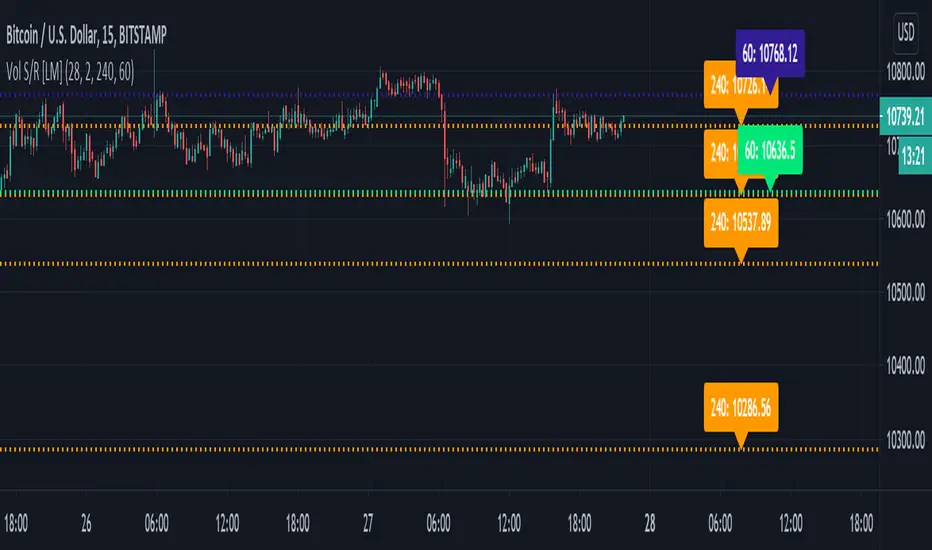
I would like to introduce you volume support and resistance horizontals. It draws line horizontal on high and low high volume candles that has volume above volume MA for certain period multiplied by multiplier and also the volume is increasing from previous volume . You can select lines on this timeframe and/or another one.
The colors are dynamic depending whether price is below or above the line:
for the current timeframe green is used for support and blue for resistance
for the other timeframe by default 4h orange is used for support and violet for resistance
There are various sections in setting:
volume - here you can select SMA volume length and multiplier
show and hide section of the current timeframe
other timeframe
show and hide other timeframe horizontals
I'm mainly looking smaller timeframe and trading higher timeframe from level to level
Any suggestions are welcome
Versionshinweise
fixing multi timeframe behaviorVersionshinweise
adding another timeframe and labels for valuesVersionshinweise
update to version 5Open-source Skript
Ganz im Sinne von TradingView hat dieser Autor sein/ihr Script als Open-Source veröffentlicht. Auf diese Weise können nun auch andere Trader das Script rezensieren und die Funktionalität überprüfen. Vielen Dank an den Autor! Sie können das Script kostenlos verwenden, aber eine Wiederveröffentlichung des Codes unterliegt unseren Hausregeln.
Haftungsausschluss
Die Informationen und Veröffentlichungen sind nicht als Finanz-, Anlage-, Handels- oder andere Arten von Ratschlägen oder Empfehlungen gedacht, die von TradingView bereitgestellt oder gebilligt werden, und stellen diese nicht dar. Lesen Sie mehr in den Nutzungsbedingungen.
Open-source Skript
Ganz im Sinne von TradingView hat dieser Autor sein/ihr Script als Open-Source veröffentlicht. Auf diese Weise können nun auch andere Trader das Script rezensieren und die Funktionalität überprüfen. Vielen Dank an den Autor! Sie können das Script kostenlos verwenden, aber eine Wiederveröffentlichung des Codes unterliegt unseren Hausregeln.
Haftungsausschluss
Die Informationen und Veröffentlichungen sind nicht als Finanz-, Anlage-, Handels- oder andere Arten von Ratschlägen oder Empfehlungen gedacht, die von TradingView bereitgestellt oder gebilligt werden, und stellen diese nicht dar. Lesen Sie mehr in den Nutzungsbedingungen.