CommonMarkup
Provides functions for chart markup, such as indicating recession bands.
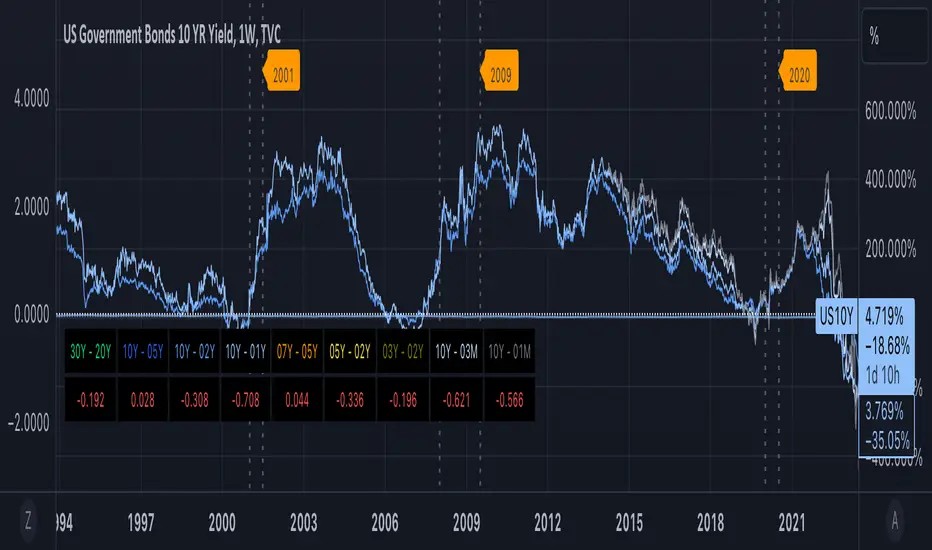
markRecessionBands(showBands, lineY, labelY)
Mark vertical bands and show recession band labels if argument showBands is true. Example "markRecessionBands(bar_index[0],3.0"
Parameters:
showBands: - show vertical recession bands when true. Functionally equiv to no op when false
lineY: - y-axis value for line positioning
labelY: - y-axis value for label positioning
return true - always answers the value of showBands
- Added 2022 contraction over Q1 to Q2
- Updated time refs to be UTC+0
Added control parameter for defining if 2 consecutive quarters of negative GDP is considered a recession
Updated:
markRecessionBands(showBands, twoQrtsOfNegativeGDPIsRecession, lineY, labelY)
Mark vertical bands and show recession band labels if argument showBands is true. Example "markRecessionBands(bar_index[0],3.0"
Parameters:
showBands: - show vertical recession bands when true. Functionally equiv to no op when false
twoQrtsOfNegativeGDPIsRecession: - if true, then periods with two consecutive quarters of negative GDP is considered a recession. Defaut is false.
lineY: - y-axis value for line positioning
labelY: - y-axis value for label positioning
return true - always answers the value of showBands
Updated:
markRecessionBands(showBands, twoQrtsOfNegativeGDPIsRecession, labelY)
Mark vertical bands and show recession band labels if argument showBands is true. Example "markRecessionBands(bar_index[0],false3.0)"
Parameters:
showBands (bool): - show vertical recession bands when true. Functionally equiv to no op when false
twoQrtsOfNegativeGDPIsRecession (bool): - if true, then periods with two consecutive quarters of negative GDP are considered a recession. Defaut is false.
labelY (float): - y-axis value for label positioning
return true - always answers the value of showBands
Updated:
- Resolved issue with private function for drawing recession bands scaling the y-axis excessively
Pine Bibliothek
Ganz im Sinne von TradingView hat dieser Autor seinen/ihren Pine Code als Open-Source-Bibliothek veröffentlicht. Auf diese Weise können nun auch andere Pine-Programmierer aus unserer Community den Code verwenden. Vielen Dank an den Autor! Sie können diese Bibliothek privat oder in anderen Open-Source-Veröffentlichungen verwenden. Die Nutzung dieses Codes in einer Veröffentlichung wird in unseren Hausregeln reguliert.
Haftungsausschluss
Pine Bibliothek
Ganz im Sinne von TradingView hat dieser Autor seinen/ihren Pine Code als Open-Source-Bibliothek veröffentlicht. Auf diese Weise können nun auch andere Pine-Programmierer aus unserer Community den Code verwenden. Vielen Dank an den Autor! Sie können diese Bibliothek privat oder in anderen Open-Source-Veröffentlichungen verwenden. Die Nutzung dieses Codes in einer Veröffentlichung wird in unseren Hausregeln reguliert.