OPEN-SOURCE SCRIPT
ProRSI

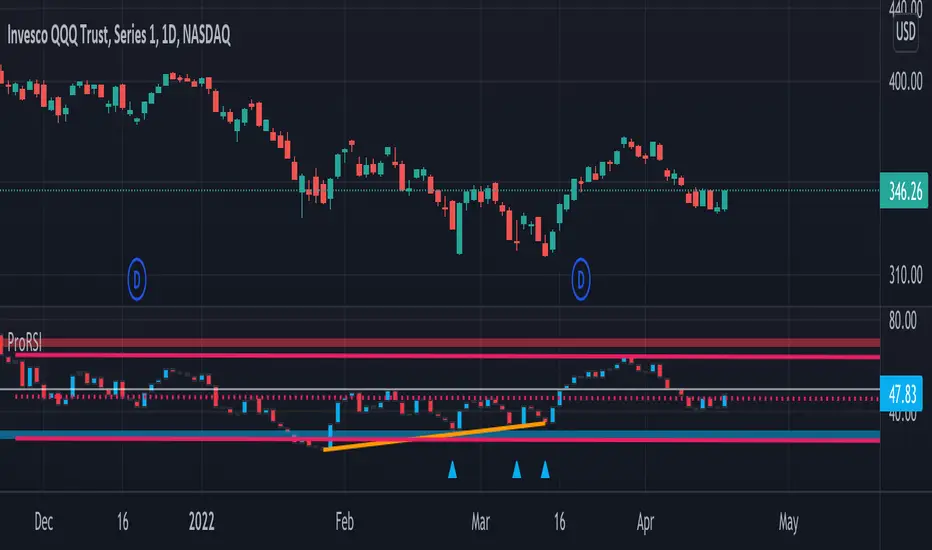
ProRSI is another in indicator to add to the Pro Indicator suite by DynaProTrading. This algo is made up of a few key components referenced below.
RSI: The primary function of the algo is to plot the candles of the ticker of choice on an oscillator pane to show how price compared to the various key levels. As you can see the red and blue arrows indicator oversold and overbought levels in conjunction with price.
Divergences: In addition to the RSI alerts, there is also a divergence functions where price could be making a higher high but the RSI indicator is making a lower high which is indicating a divergence in price. This is displayed by the lines in the lower window pane from one peak to another.
Trend Lines: Trend lines exist in all technical analysis but in this indicator, it shows the trend lines of the candles in the RSI pane which can help find support and resistance just like with normal price action.
Regression Model: The last key component of the indicator is a regression model which acts as a trend channel for more recent price action.
Open-source Skript
Ganz im Sinne von TradingView hat dieser Autor sein/ihr Script als Open-Source veröffentlicht. Auf diese Weise können nun auch andere Trader das Script rezensieren und die Funktionalität überprüfen. Vielen Dank an den Autor! Sie können das Script kostenlos verwenden, aber eine Wiederveröffentlichung des Codes unterliegt unseren Hausregeln.
Haftungsausschluss
Die Informationen und Veröffentlichungen sind nicht als Finanz-, Anlage-, Handels- oder andere Arten von Ratschlägen oder Empfehlungen gedacht, die von TradingView bereitgestellt oder gebilligt werden, und stellen diese nicht dar. Lesen Sie mehr in den Nutzungsbedingungen.