OPEN-SOURCE SCRIPT
Aktualisiert Good Signal Indicator
Description:
The Good Signal Indicator utilizes Exponential Moving Averages (EMA) across multiple timeframes to provide buy or sell signals based on the relative positioning of short-term and long-term EMAs.
Features:
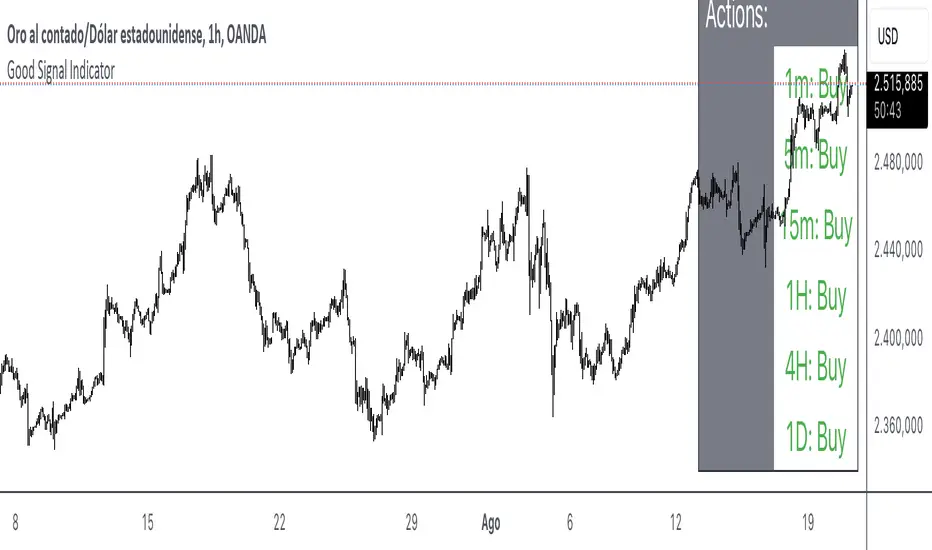
Multiple Timeframes: Includes EMAs for 1 minute, 5 minutes, 15 minutes, 1 hour, 4 hours, and 1 day.
Customizable Settings: Allows for the configuration of EMA lengths (20 and 50 periods).
Clear Signals: Displays buy, sell, or neutral signals on a table for each timeframe.
How It Works:
EMA Calculation: Computes the EMA values for specified lengths and timeframes.
Signal Generation: Determines buy and sell signals based on whether the current EMA is above or below the EMA from 30 bars ago.
Table Display: Presents the signals in a table at the bottom-right of the chart, showing whether to buy, sell, or hold for each timeframe.
Usage Instructions:
Apply the Indicator: Add the script to your TradingView chart.
Review Signals: Observe the table to understand the current trend for each timeframe.
Adjust Settings: Customize the EMA lengths if needed to fit your trading strategy.
Example Chart:
Ensure your chart is clean, showing only the indicator table without additional clutter. The table should clearly reflect the current buy, sell, or neutral status based on the EMA calculations.
Disclaimer: This indicator is a tool for analysis and should be used in conjunction with other indicators and market research. Always test with historical data before applying it to live trading.
The Good Signal Indicator utilizes Exponential Moving Averages (EMA) across multiple timeframes to provide buy or sell signals based on the relative positioning of short-term and long-term EMAs.
Features:
Multiple Timeframes: Includes EMAs for 1 minute, 5 minutes, 15 minutes, 1 hour, 4 hours, and 1 day.
Customizable Settings: Allows for the configuration of EMA lengths (20 and 50 periods).
Clear Signals: Displays buy, sell, or neutral signals on a table for each timeframe.
How It Works:
EMA Calculation: Computes the EMA values for specified lengths and timeframes.
Signal Generation: Determines buy and sell signals based on whether the current EMA is above or below the EMA from 30 bars ago.
Table Display: Presents the signals in a table at the bottom-right of the chart, showing whether to buy, sell, or hold for each timeframe.
Usage Instructions:
Apply the Indicator: Add the script to your TradingView chart.
Review Signals: Observe the table to understand the current trend for each timeframe.
Adjust Settings: Customize the EMA lengths if needed to fit your trading strategy.
Example Chart:
Ensure your chart is clean, showing only the indicator table without additional clutter. The table should clearly reflect the current buy, sell, or neutral status based on the EMA calculations.
Disclaimer: This indicator is a tool for analysis and should be used in conjunction with other indicators and market research. Always test with historical data before applying it to live trading.
Versionshinweise
Description:The Good Signal Indicator utilizes Exponential Moving Averages (EMA) across multiple timeframes to provide buy or sell signals based on the relative positioning of short-term and long-term EMAs.
Features:
Multiple Timeframes: Includes EMAs for 1 minute, 5 minutes, 15 minutes, 1 hour, 4 hours, and 1 day.
Customizable Settings: Allows for the configuration of EMA lengths (20 and 50 periods).
Clear Signals: Displays buy, sell, or neutral signals on a table for each timeframe.
How It Works:
EMA Calculation: Computes the EMA values for specified lengths and timeframes.
Signal Generation: Determines buy and sell signals based on whether the current EMA is above or below the EMA from 30 bars ago.
Table Display: Presents the signals in a table at the bottom-right of the chart, showing whether to buy, sell, or hold for each timeframe.
Usage Instructions:
Apply the Indicator: Add the script to your TradingView chart.
Review Signals: Observe the table to understand the current trend for each timeframe.
Adjust Settings: Customize the EMA lengths if needed to fit your trading strategy.
Example Chart:
Ensure your chart is clean, showing only the indicator table without additional clutter. The table should clearly reflect the current buy, sell, or neutral status based on the EMA calculations.
Disclaimer: This indicator is a tool for analysis and should be used in conjunction with other indicators and market research. Always test with historical data before applying it to live trading.
Open-source Skript
Ganz im Sinne von TradingView hat dieser Autor sein/ihr Script als Open-Source veröffentlicht. Auf diese Weise können nun auch andere Trader das Script rezensieren und die Funktionalität überprüfen. Vielen Dank an den Autor! Sie können das Script kostenlos verwenden, aber eine Wiederveröffentlichung des Codes unterliegt unseren Hausregeln.
Haftungsausschluss
Die Informationen und Veröffentlichungen sind nicht als Finanz-, Anlage-, Handels- oder andere Arten von Ratschlägen oder Empfehlungen gedacht, die von TradingView bereitgestellt oder gebilligt werden, und stellen diese nicht dar. Lesen Sie mehr in den Nutzungsbedingungen.