OPEN-SOURCE SCRIPT
EPS & Sales
Aktualisiert
Hi everyone,
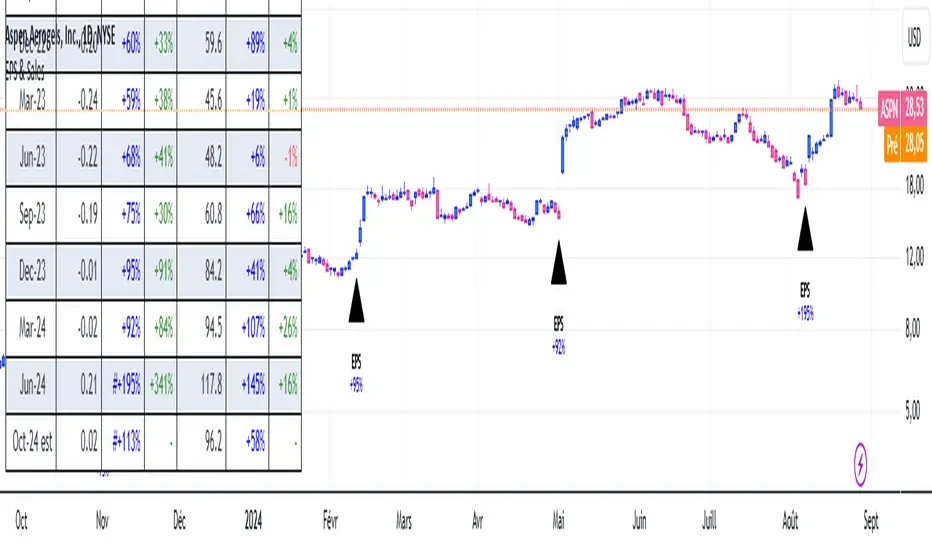
I just adapted a little utility script to visualise EPS % increase (quarters vs Year -1) and sales.
I used the code from ARUN_SAXENA and modified it to fix what I saw as issues.
(Using base 3M instead of 1M +
request.earnings(syminfo.tickerid, earnings.actual, ignore_invalid_symbol=true)
instead of
request.financial(syminfo.tickerid, "EARNINGS_PER_SHARE", "FQ")
Data will differ from MarketSmith because they use sometimes actual EPS sometimes standard, but think we can at least trust what we see in term of %
The tool is far from being perfect !
Versionshinweise
Just modified a condition that was making the script bug on given chartsVersionshinweise
MarketSmith tag addedVersionshinweise
Modified:- Displays NaN when both EPS used for calculation are negative
- Displays + when increase is positive :)
- Modified calculation system, use the closer EPS to 0 when both reported and standard EPS are negative
We are now very close to the calculation method of MarketSmith.
Sometimes number differs but results are often close when differents.
To be honest I always confirm with shared graph on Twitter.
Versionshinweise
Now displays '#' in front of EPS growth % to indicate if an EPS for calculation is negativeVersionshinweise
Modified some comments to help to understand what I did.if you have any constructive suggestions, please let me know in the comments
Versionshinweise
- You can now change colors to suit your themeVersionshinweise
- Removed indicators that were polluting the visual overviewVersionshinweise
- Adjusted Original ColorsVersionshinweise
- The Script is now directly added to the chart when added- Removed the grid transparency
- Added the possibility to choose the position of the table
Versionshinweise
- Added the possibility to show the gross margin- Tried to display Yearly EPS but highly inaccurate results convinced me to only keep the code under comments in case someone one day is able to calculate manually ?
- I'm still not satisfied with the code.
Ex:
- CELH one result is missing
-AEHR, this shoudn't happen but in Da, We, Mo, results differs. The problem is that we need to search previous earning with time and sometimes it defers from one stock to another.
I would love to find a way to get previous earning without using the time.
Versionshinweise
- I have removed the colour from the table frame as it pollutes the price graphVersionshinweise
- Modified the code because the case where actual EPS was negative and reported EPS was positive was not taken into account.(Now the '#' is diplayed correctly)
- Added the possibility to display ROE
- Added the possibility to show EPS used for calculation
Versionshinweise
- Now return NaN when last EPS is negative and EPS of the previous year is positiveVersionshinweise
- Now possible to plot EPS curve on the graph with another scale on the left.Please tell me if you don't like this update, because it adds a left scale whether this new option is checked or not
Versionshinweise
- I finally corrected the time base period and replace the "3M" by the function barssince. This corrected the bug on AEHR.I complained about if few updates ago :)
Versionshinweise
- Found that plotting EPS line on another scale was not very usefullSo I decided to replace them by Arrow on the chart showing EPS date and EPS % variation as you can see on MarketSmith graph
I have no solution to plot them at the bottom of the graph, if you know how, don't hesitate to tell me in comment
(I can't reply to personal messages for now)
Versionshinweise
- Corrected the case in which EPS display is negative to avoid +-50% Versionshinweise
- Now the color of positive or negative variations also affects the color of the text under the arrows- You can select arrow colors
- You can select the 'EPS' text color
Versionshinweise
- You can now adjust the size of the table.Versionshinweise
- Corrected the case where arrow displayed the wrong balue between EPS reported or standardVersionshinweise
- Modified the case in which when both reported and standard EPS are negative, but the closer to 0 is > than -0.01, is not taken into account.(Corrected the #+999% in APA which was #+712%)
Versionshinweise
- Added comparison regarding sales too- Renamed all the variables in the code that were confusing
(+ some comments here and there to facilitate understanding)
- Integrated the calculation of QoQ EPS without changing the general appearance of the script
(This way I hope I won't be HARASSED anymore :p)
- Added the viewing of 3 additional quarters
And finally...
- I really hope that, like me, you'll love the new look ! (If not you can still save it to your taste)
Versionshinweise
(forgot to remove drawings on the chart...!)Versionshinweise
- Corrected the display of QoQ Eps when equals to YoY (could have and unforced # in front of result)Versionshinweise
- Finally managed to display the quarters in MMM-yy format:-)
Versionshinweise
- And corrected size of the text of the date that I forgot !
Versionshinweise
- Arranged the settings to allow an easier and more intuitive customization of the interface
Versionshinweise
Added :
- Now possible to see Sales on the graph under EPS information
- Changed the QoQ visual
- Added Sales QoQ
- Reorganised Input
- Now possible to change text Color on the graph independently
Versionshinweise
- Reduced the number of label to allow more historical data on the graph (regarding arrow part)
Versionshinweise
- Replaced 'NaN%' by 'N/A' and change color from red to black. Versionshinweise
- Added the correct display of N/A vs N/A instead of NaN vs NaN on the table and on the arrows- Changed color of the case where variation% = 0% in black color. (Both EPS & Sales)
- Corrected the display of +/-∞% by N/A.
Versionshinweise
Arrow part:- Modified NaN% value to N/A
- Modifier N/A color
- Corrected the 0% color
Table part:
- Changed GROSS MARGIN into GM
- Corrected the case where eps1 was negative and eps4 was 0 -∞% -> N/A
- NaN vs NaN -> N/A vs N/A on QQQ
- Recorrected the 0% color
(I think TV displayed me an old previous version of the script so I had to re-write the two last points)
Versionshinweise
- Now +0% in blue is turned to 0% in black :3 Versionshinweise
- On the EPS day, TradingView provides the same sales number than the previous one instead of seeking for the new one. This cause a wrong data display on the last line and it can bring confusion.I decided to identifiy this time and replace the sales and variation number by N/A. I will remove this if TradingView correct this bug.
Versionshinweise
- Same change than above but for the text under arrows on graph.Versionshinweise
- In the case of a sales display changed to N/A on the EPS day, the script now displays the sales value as soon as it is available. Here in the post-market of the earning day.Versionshinweise
- Added the case where Sales are the same the day after the earning eventVersionshinweise
- Correction of a bug with the last updateVersionshinweise
- Corrected the display of x,x Bil$ to xxxx,x Mil like MarketSmith- Corrected the case where sales are the same number at day+1 after eanring event
Versionshinweise
- Added a black Frame arround the tableVersionshinweise
- Changed the size of the column to have the same ratio than MarketSmith's table- Changed the Graph for better presentation
Versionshinweise
- Adjusted Colors- Input have been reorganised and simplified
Versionshinweise
- Arrow size is now adjustable- We can now display the %variation anyway even if the actual/reported EPS is negative
- Limitation added to -999%
- We can now display surprises on the table
- Input reorganised
Versionshinweise
- Little mistake on inputs, my bad! CorrectedVersionshinweise
- Corrected the display that was broken when "Surprise" and "Less Quarters" were checked.- Changed to Presentation Graph
Versionshinweise
-Now possible to display the Daily Table of EPS & Sales.(I did it because I was asked many times, I am not very satisfied with the result, the table functions of tradingview are not flexible enough to do everything I would like to do.
There are now inputs that manage the appearance of both tables.)
-Data alignment
Versionshinweise
- Added a delimitation on the table type DailyVersionshinweise
- Corrected a display in the Daily tableVersionshinweise
- Corrected a wrong color in the Daily tableVersionshinweise
- The space between the title and the result is as close as possible to the one of MarketSmith- Changed the presentation graphique
Versionshinweise
- Arranged the | on the Daily Table not to appear when Table Border is set to 1Versionshinweise
- Added max_albels_count = 500 to display more historical arrows on the graph- Organized the alignment of the column (Surprise, ROE, GM)
- Used another method for sales and EPS to have as much historical data as possible, currently 3 variations in % on
Versionshinweise
- Modified the Sales Growth YOY method calculation to display more data on IPO.Impressive results for example on IOT where we can display 4 additional lines compared to the previous method
Versionshinweise
- Corrected the way to detect a duplicate in the recent sales announcementVersionshinweise
- Corrected the case where sales number where the new sales figure was updated and not the % change for recent earningVersionshinweise
- Corrected a minor bug that occured when two earnings where close one to another and we had the same % variation. Now the code detects it and recalculate the variation.Versionshinweise
- Modified the order of the table Size selection in the inputVersionshinweise
- Added customisable table border and frame- Corrected the Gross Margin and Return on Equity offset
Versionshinweise
- The oppocity of the weekly table is now working. Thank you bognog for pointing the issue.Versionshinweise
- Corrected shifting color to transparant of the daily table- Now the script runs if don't find fundamental data
Versionshinweise
- Added Estimates for the very next Earning to come- YoY and QoQ can be viewed separately
- We can now view the QoQ %Change on arrows
- EPS Due date has been added on HeadBand type table
- Default setting now show the Surprise variation
- Reorganised inputs
- Changed the look of the table toward new 'MarketSurge' type look
Versionshinweise
- Corrected wrong digit on the 'versus' display on sales after B_Kaminski pointed it outVersionshinweise
- Corrected the display of # and N/A for estimates- Simplified the # and N/A System detection
- Added # system as an input option
- Added Quick pre-designed looks based on MarketSmith and MarketSurge Tables
- Corrected GM and ROE estimations values from 0% towards -
- Made the display of variation% of EPS & Sales without arrows as an option
Versionshinweise
- Corrected the MarketSurge Type Table Look- Added the variation when negative EPS by default
Versionshinweise
- Corrected Minor Mistake of # when next EPS quarter was negative calculated against negative EPS. Now display the same value without '#' as MarketSurge doesVersionshinweise
- Modified the style of the table toward MarketSurge look- Used lighter grey for the MarketSmith table
Open-source Skript
Ganz im Sinne von TradingView hat dieser Autor sein/ihr Script als Open-Source veröffentlicht. Auf diese Weise können nun das Script auch andere Trader verstehen und prüfen. Vielen Dank an den Autor! Sie können das Script kostenlos verwenden. Die Nutzung dieses Codes in einer Veröffentlichung wird in unseren Hausregeln reguliert. Sie können es als Favoriten auswählen, um es in einem Chart zu verwenden.
Haftungsausschluss
Die Informationen und Veröffentlichungen sind nicht als Finanz-, Anlage-, Handels- oder andere Arten von Ratschlägen oder Empfehlungen gedacht, die von TradingView bereitgestellt oder gebilligt werden, und stellen diese nicht dar. Lesen Sie mehr in den Nutzungsbedingungen.