OPEN-SOURCE SCRIPT
Triple EMA Distance Indicator
Triple EMA Distance Indicator
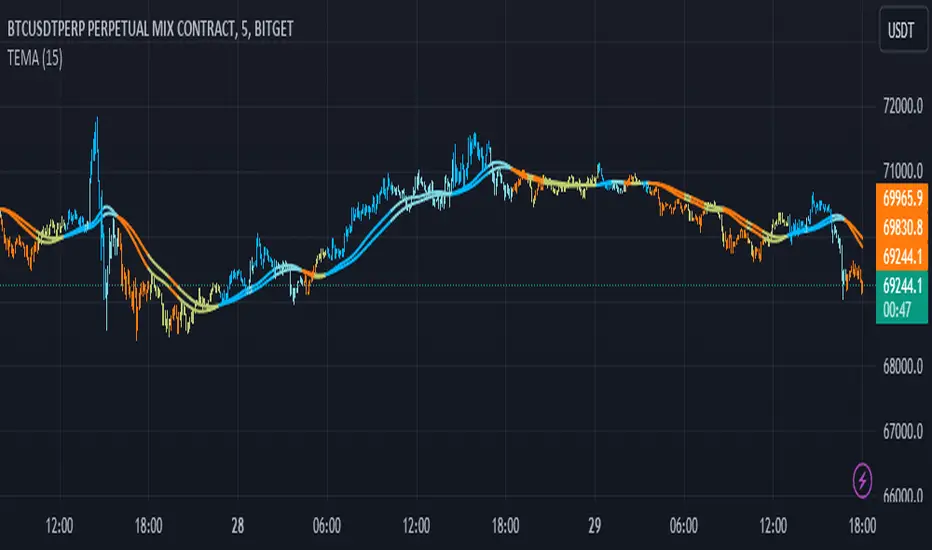
The Triple EMA Distance indicator comprises two sets of triple exponential moving averages (EMAs). One set uses the same smoothing length for all EMAs, while the other set doubles the length for the last EMA. This indicator provides visual cues based on the relationship between these EMAs and candlestick patterns.
Blue Condition:
Indicates when the fast EMA is above the slow EMA.
The distance between the two EMAs is increasing.
Candlesticks and EMAs are colored light blue.
Orange Condition:
Activates when the fast EMA is below the slow EMA.
The distance between the two EMAs is increasing.
Candlesticks and EMAs are colored orange.
Beige Condition:
Occurs when the fast EMA is below the slow EMA.
The distance between the two EMAs is decreasing.
Candlesticks and EMAs are colored beige.
Light Blue Condition:
Represents when the fast EMA is above the slow EMA.
The distance between the two EMAs is decreasing.
Candlesticks and EMAs are colored light blue.
Open-source Skript
Ganz im Sinne von TradingView hat dieser Autor sein/ihr Script als Open-Source veröffentlicht. Auf diese Weise können nun auch andere Trader das Script rezensieren und die Funktionalität überprüfen. Vielen Dank an den Autor! Sie können das Script kostenlos verwenden, aber eine Wiederveröffentlichung des Codes unterliegt unseren Hausregeln.
Haftungsausschluss
Die Informationen und Veröffentlichungen sind nicht als Finanz-, Anlage-, Handels- oder andere Arten von Ratschlägen oder Empfehlungen gedacht, die von TradingView bereitgestellt oder gebilligt werden, und stellen diese nicht dar. Lesen Sie mehr in den Nutzungsbedingungen.