OPEN-SOURCE SCRIPT
B's Average RSI (5m-1D)
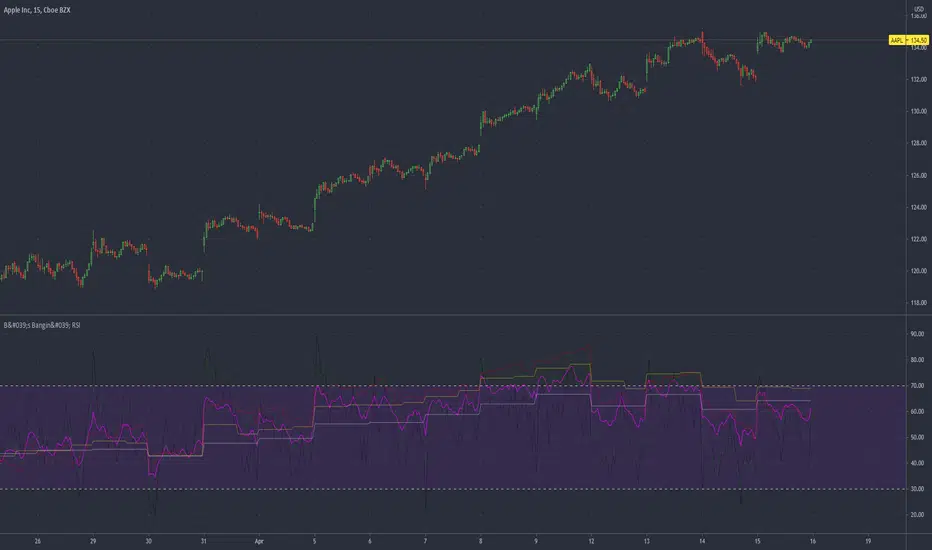
Multiple time frame RSIs plotted onto a single indicator.
Time frames used are:
5m (black)
15m (green)
60m (red)
240m (yellow)
Daily (white)
An average of all of the RSIs (pink)
RSI's are averaged into a single line. Also functions as multiple RSI's.
The pink average line should be used like any other RSI:
Above or below 50 signifies strength and weakness, respectively.
Above 80 and below 20 signal overbought and oversold conditions, respectively.
Open-source Skript
Ganz im Sinne von TradingView hat dieser Autor sein/ihr Script als Open-Source veröffentlicht. Auf diese Weise können nun auch andere Trader das Script rezensieren und die Funktionalität überprüfen. Vielen Dank an den Autor! Sie können das Script kostenlos verwenden, aber eine Wiederveröffentlichung des Codes unterliegt unseren Hausregeln.
Haftungsausschluss
Die Informationen und Veröffentlichungen sind nicht als Finanz-, Anlage-, Handels- oder andere Arten von Ratschlägen oder Empfehlungen gedacht, die von TradingView bereitgestellt oder gebilligt werden, und stellen diese nicht dar. Lesen Sie mehr in den Nutzungsbedingungen.