OPEN-SOURCE SCRIPT
Aktualisiert LowHighFinder
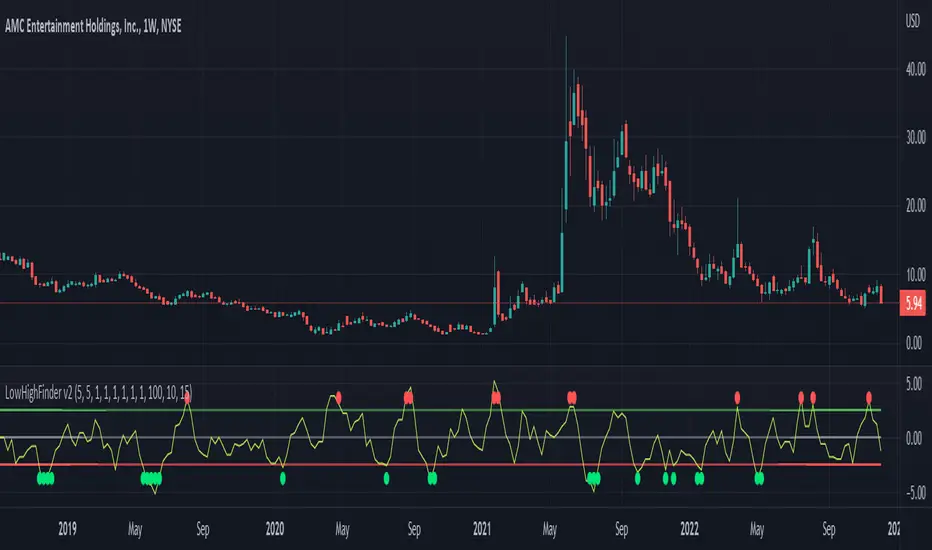
This chart display how value change of (low,high,close,open) is considered as a factor for buying or selling. Each element take same weight when consider the final price. The price change over a certain threshold would be the decision point (buy/sell)
Factors considered in this chart
1.Quotes: High,low,close,open,volume. If one of them higher than previous day, then it increase, otherwise decreases.
2. Multipler: If you think one quote is more important than other (High more important than close, you can set multipler higher)
3. EMA smoother: It is using to balance the price effect. Like if price increased dramatically, EMA would notify whether could be a good time to sell. (Because high deviation between MA and price suggest price increase too fast)
4. Length of line: set length of line for you need
5. Percentage change: how much percentage change is considered a significant change? 5%? or 10%? In which case should it count toward the final indicator? Adjust percentage change needed, smaller for minutes chart (less than 10) higher for hours chart (10-20), even higher for day chart
Buy/Sell method:
1. When green dot appears, wait after price start to get close to moving average to find the low point and buy.
2. Reverse for red dot.
Versionshinweise
Update: 2022/12/121. Red dot not showing
Open-source Skript
Ganz im Sinne von TradingView hat dieser Autor sein/ihr Script als Open-Source veröffentlicht. Auf diese Weise können nun auch andere Trader das Script rezensieren und die Funktionalität überprüfen. Vielen Dank an den Autor! Sie können das Script kostenlos verwenden, aber eine Wiederveröffentlichung des Codes unterliegt unseren Hausregeln.
Haftungsausschluss
Die Informationen und Veröffentlichungen sind nicht als Finanz-, Anlage-, Handels- oder andere Arten von Ratschlägen oder Empfehlungen gedacht, die von TradingView bereitgestellt oder gebilligt werden, und stellen diese nicht dar. Lesen Sie mehr in den Nutzungsbedingungen.