OPEN-SOURCE SCRIPT
Number of Bars CheatSheet
A regular trading day on the New York Stock Exchange (NYSE) consists of two main sessions: the Opening Auction and the Closing Auction, separated by a continuous trading session. Here's a breakdown of the trading day:
1. **Pre-Opening Session**: This session starts at 4:00 AM Eastern Time (ET) and lasts until 9:30 AM ET. During this time, there is limited trading activity, and orders can be entered and canceled. However, most of the trading activity doesn't occur until the regular trading session begins.
2. **Regular Trading Session**: The regular trading session on the NYSE starts at 9:30 AM ET and lasts until 4:00 PM ET. This is the primary trading session where the majority of price bars are formed.
3. **Closing Auction**: After the regular trading session ends at 4:00 PM ET, there is a closing auction period that typically lasts until 4:10 PM ET. During this time, there is a final price discovery process where orders are matched to determine the closing price for each security.
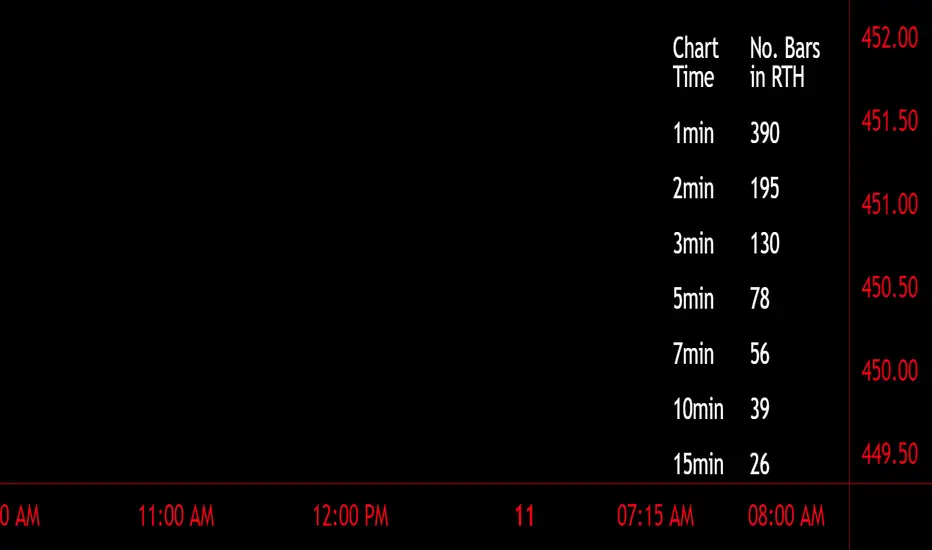
So, during the regular trading session, which is the main focus for most traders and investors, there are a total of 6.5 hours of trading. Trading occurs continuously during this time, with price bars being formed based on the time frame you're looking at. The most common time frames for price bars are one minute, five minutes, 15 minutes, 30 minutes, and one hour, among others. Therefore, the number of price bars in a regular trading day on the NYSE will depend on the time frame you are using for your analysis. For example, if you are using one-minute bars, there will be 6.5 x 60 = 390 price bars in a regular trading day.
1. **Pre-Opening Session**: This session starts at 4:00 AM Eastern Time (ET) and lasts until 9:30 AM ET. During this time, there is limited trading activity, and orders can be entered and canceled. However, most of the trading activity doesn't occur until the regular trading session begins.
2. **Regular Trading Session**: The regular trading session on the NYSE starts at 9:30 AM ET and lasts until 4:00 PM ET. This is the primary trading session where the majority of price bars are formed.
3. **Closing Auction**: After the regular trading session ends at 4:00 PM ET, there is a closing auction period that typically lasts until 4:10 PM ET. During this time, there is a final price discovery process where orders are matched to determine the closing price for each security.
So, during the regular trading session, which is the main focus for most traders and investors, there are a total of 6.5 hours of trading. Trading occurs continuously during this time, with price bars being formed based on the time frame you're looking at. The most common time frames for price bars are one minute, five minutes, 15 minutes, 30 minutes, and one hour, among others. Therefore, the number of price bars in a regular trading day on the NYSE will depend on the time frame you are using for your analysis. For example, if you are using one-minute bars, there will be 6.5 x 60 = 390 price bars in a regular trading day.
Open-source Skript
Ganz im Sinne von TradingView hat dieser Autor sein/ihr Script als Open-Source veröffentlicht. Auf diese Weise können nun auch andere Trader das Script rezensieren und die Funktionalität überprüfen. Vielen Dank an den Autor! Sie können das Script kostenlos verwenden, aber eine Wiederveröffentlichung des Codes unterliegt unseren Hausregeln.
Haftungsausschluss
Die Informationen und Veröffentlichungen sind nicht als Finanz-, Anlage-, Handels- oder andere Arten von Ratschlägen oder Empfehlungen gedacht, die von TradingView bereitgestellt oder gebilligt werden, und stellen diese nicht dar. Lesen Sie mehr in den Nutzungsbedingungen.