OPEN-SOURCE SCRIPT
Aktualisiert Volume + RSI & MA Differential

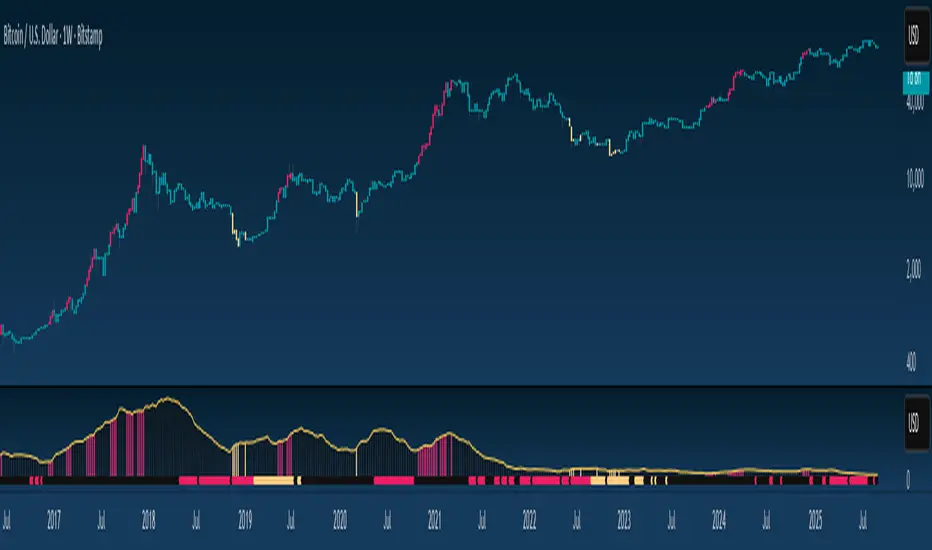
"Volume + RSI & MA Differential," integrates volume, RSI, and moving average differentials to generate trading signals. The script calculates a 14-period RSI to identify overbought or oversold conditions, with customizable thresholds for buy and sell signals. It also computes a 20-period SMA of the volume to smooth out trading activity data, helping to identify trends in market participation.
The script incorporates a fast (50-period) and a slow (200-period) SMA to analyze short-term and long-term trends, respectively. The differential between these moving averages, adjusted by the volume SMA, is used to identify potential trend changes or confirmations. Bars are colored yellow when the RSI is below the buy threshold and volume is high, indicating a potential buy signal. Conversely, bars turn red when the RSI is above the sell threshold and the fast MA is below the current close price, suggesting a potential sell signal. Neutral conditions result in grey bars.
Additionally, the script uses color-coding to plot the volume SMA and a line that changes color based on the moving average differential. A black line indicates a broadening MA cloud and a bullish trend, while a grey line suggests a narrowing MA cloud and a potential selloff. A yellow line signals the beginning of a buyback. This visual representation helps traders quickly identify potential trading opportunities and trend changes, making the script a valuable tool for technical analysis.
Versionshinweise
Updated Default ValuesVersionshinweise
Adjust OverlayOpen-source Skript
Ganz im Sinne von TradingView hat dieser Autor sein/ihr Script als Open-Source veröffentlicht. Auf diese Weise können nun auch andere Trader das Script rezensieren und die Funktionalität überprüfen. Vielen Dank an den Autor! Sie können das Script kostenlos verwenden, aber eine Wiederveröffentlichung des Codes unterliegt unseren Hausregeln.
Haftungsausschluss
Die Informationen und Veröffentlichungen sind nicht als Finanz-, Anlage-, Handels- oder andere Arten von Ratschlägen oder Empfehlungen gedacht, die von TradingView bereitgestellt oder gebilligt werden, und stellen diese nicht dar. Lesen Sie mehr in den Nutzungsbedingungen.
Open-source Skript
Ganz im Sinne von TradingView hat dieser Autor sein/ihr Script als Open-Source veröffentlicht. Auf diese Weise können nun auch andere Trader das Script rezensieren und die Funktionalität überprüfen. Vielen Dank an den Autor! Sie können das Script kostenlos verwenden, aber eine Wiederveröffentlichung des Codes unterliegt unseren Hausregeln.
Haftungsausschluss
Die Informationen und Veröffentlichungen sind nicht als Finanz-, Anlage-, Handels- oder andere Arten von Ratschlägen oder Empfehlungen gedacht, die von TradingView bereitgestellt oder gebilligt werden, und stellen diese nicht dar. Lesen Sie mehr in den Nutzungsbedingungen.