PROTECTED SOURCE SCRIPT
Goldbach Time Indicator
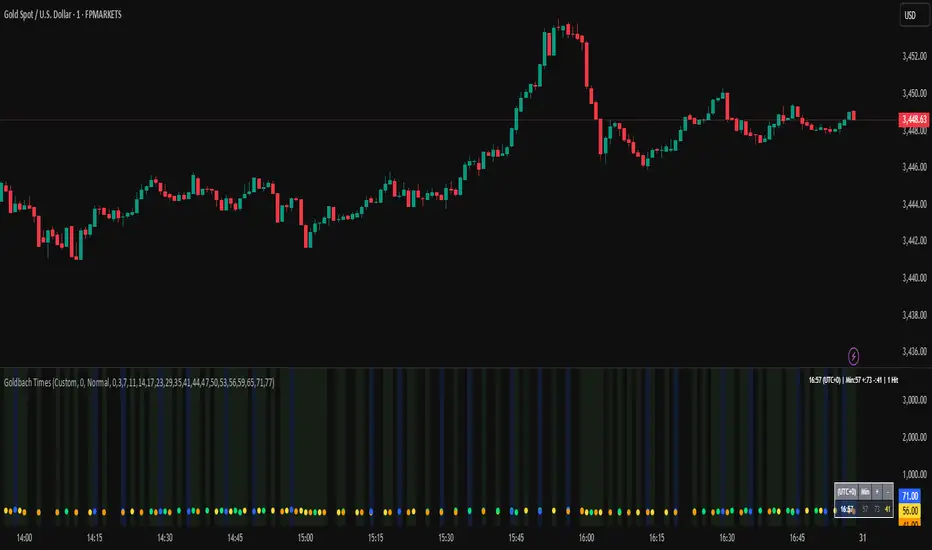
Goldbach Time Indicator (Minute Algebra + Core Levels)
A time-based discovery tool that maps minute arithmetic to a curated set of “Goldbach levels” (0–77) and highlights core reliable levels (29, 35, 71, 77) on any symbol/timeframe. It’s designed for session timing, event clustering, and pattern research—not price prediction.
What it shows
Three per-bar minute transforms:
Min = current minute (00–59)
Min+Hr = minute + hour (mapped, 60 → 00; valid up to 77)
Min−Hr = |minute − hour| (auto-chooses positive variant; 60 → 00)
Hit detection: marks a bar if any transform lands on an allowed Goldbach level.
Core emphasis: special tint/labels for 29, 35, 71, 77.
Optional background highlight (green for hits, blue tint when a core level is present).
Large corner readouts (optional): current Min / Min+Hr / Min−Hr with ✓ or ⭐ for core.
Detailed table: current time (your chosen timezone) + the three values and their status.
Histogram (optional): total hits and core hits under the chart.
Hover tooltips: per-bar time + which transforms hit (and whether they’re core).
Inputs & controls
Timezone Preset: UTC, New York, Tokyo, London, Sydney, or Custom UTC Offset.
Display toggles: Large number panels, Detailed table, Histogram, Horizontal reference lines.
Levels:
Standard set: 0,3,7,11,14,17,23,29,35,41,44,47,50,53,56,59,65,71,77
Core Only: show just 29, 35, 71, 77
Custom: paste your own comma-separated list (0–77)
Test Mode: assists with visual verification (e.g., consistent tooltips across all bars).
Core highlighting: stronger visual emphasis when a core level is hit.
How it helps
Session research: check if your strategy events cluster around certain minute signatures.
Timing filters: avoid entries during “no-hit” windows or focus on core hits.
Backtest guidance: the histogram and info panels make it easy to log/compare timing regimes.
Multi-market: independent of price scale—works for FX, indices, crypto, metals, single stocks.
Reading the visuals
Dots:
Yellow = Min, Lime = Min+Hr, Orange = Min−Hr, Blue = Core
Background:
Green = at least one hit, Blue tint = core level present
Tables/Panels: show current time (with timezone), raw values, and ✓/⭐ status.
Quick start
Choose your Timezone Preset (or set Custom UTC offset).
Start with Standard Levels; enable Core highlighting.
Turn on Detailed Table to confirm values match your venue/session.
(Optional) Show Histogram to see hit density; add Horizontal Lines for fixed references.
If needed, switch to Core Only or define Custom Levels to fit your hypothesis.
Notes & disclaimers
This is a time analytics overlay, not a buy/sell signal engine.
“Goldbach levels” here are a research framework (minute algebra 0–77) used for market-timing studies.
Always forward-test any timing rules with your strategy and risk plan.
Tags: timing, minute math, session research, clustering, core levels, UTC offset, macro timing, exploration
Geschütztes Skript
Dieses Script ist als Closed-Source veröffentlicht. Sie können es kostenlos und ohne Einschränkungen verwenden – erfahren Sie hier mehr.
Haftungsausschluss
Die Informationen und Veröffentlichungen sind nicht als Finanz-, Anlage-, Handels- oder andere Arten von Ratschlägen oder Empfehlungen gedacht, die von TradingView bereitgestellt oder gebilligt werden, und stellen diese nicht dar. Lesen Sie mehr in den Nutzungsbedingungen.