OPEN-SOURCE SCRIPT
Aktualisiert Long-Term Trend Detector

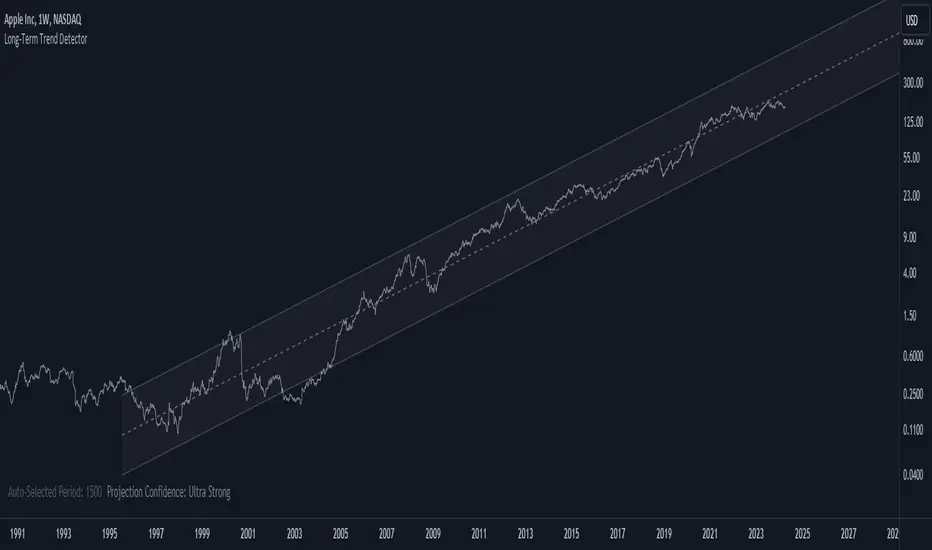
The Long-Term Trend Detector is a powerful tool designed to identify sustainable trends in price movements, offering significant advantages for traders and investors.
Key Benefits:
1. Projection Confidence: This indicator leverages Pearson's R, a statistical measure that indicates the strength of the linear relationship between price and trend projection. A higher Pearson's R value reflects a stronger correlation, providing increased confidence in the identified trend direction.
2. Adaptive Channel Detection: By calculating deviations and correlations over varying lengths, the indicator dynamically adapts to changing market conditions. This adaptive nature ensures robust trend detection across different time frames.
3. Visual Clarity: The indicator visually displays long-term trend channels on the chart, offering clear insights into potential price trajectories. This visualization aids in decision-making by highlighting periods of strong trend potential.
4. Flexibility and Customization: Users can customize parameters such as deviation multiplier, line styles, transparency levels, and display preferences. This flexibility allows traders to tailor the indicator to their specific trading strategies and preferences.
5. Historical Analysis: The indicator can analyze extensive historical data (up to 5000 bars back) to provide comprehensive trend insights. This historical perspective enables users to assess trends over extended periods, enhancing strategic decision-making.
In summary, the Long-Term Trend Detector empowers traders with accurate trend projections and confidence levels, facilitating informed trading decisions. Its adaptive nature and customizable features make it a valuable tool for identifying and capitalizing on long-term market trends.
Versionshinweise
Tooltip added:If the channel is not visible, scroll back on the chart for additional historical data.
Versionshinweise
Minor Update: I've added the ability to choose the color of the Mid Line.Versionshinweise
The Annualized Return corresponding to the period of the Selected Trend drawn by the indicator has been added. This feature is currently displayed only in the Daily timeframe.Versionshinweise
Major Update:This update introduces the 'Most Active Levels' feature.
Users can now visualize the price level with the highest trading activity within the trend channel.
This level is calculated based on either the number of price touches or trading volume.
To achieve this, the indicator divides the trend channel into multiple levels (user-defined).
Open-source Skript
Ganz im Sinne von TradingView hat dieser Autor sein/ihr Script als Open-Source veröffentlicht. Auf diese Weise können nun auch andere Trader das Script rezensieren und die Funktionalität überprüfen. Vielen Dank an den Autor! Sie können das Script kostenlos verwenden, aber eine Wiederveröffentlichung des Codes unterliegt unseren Hausregeln.
Plan the trade ⚡ Trade the plan
Haftungsausschluss
Die Informationen und Veröffentlichungen sind nicht als Finanz-, Anlage-, Handels- oder andere Arten von Ratschlägen oder Empfehlungen gedacht, die von TradingView bereitgestellt oder gebilligt werden, und stellen diese nicht dar. Lesen Sie mehr in den Nutzungsbedingungen.