OPEN-SOURCE SCRIPT
Charles Recession Watch
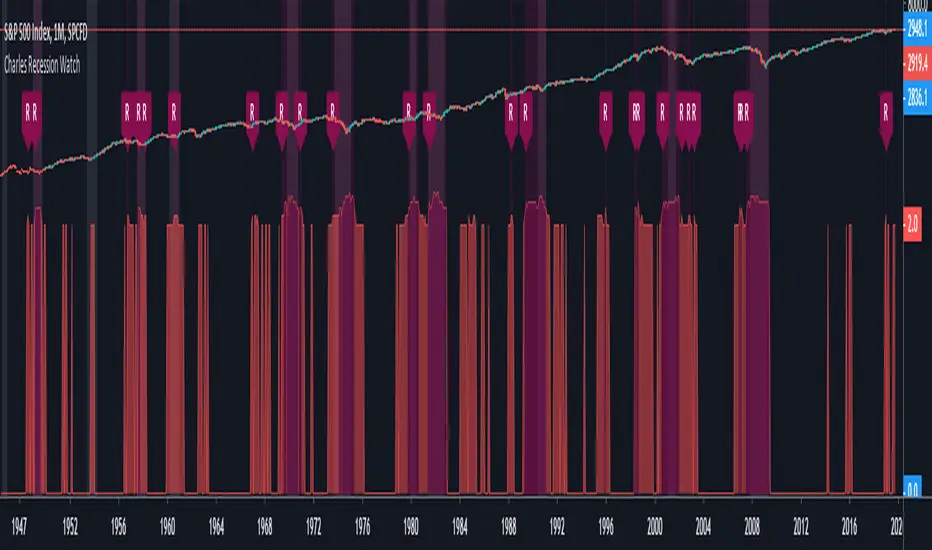
The “Recession Watch” indicator tracks 7 key economic metrics which have historically preceded US recessions. It provides a real-time indication of incoming recession risk.
This indicator gives a picture of when risk is increasing, and therefore when you might want to start taking some money out of risky assets.
All of the last seven recessions were preceded by a risk score of 3 or higher. Six of them were preceded by a risk score of 4 or higher. Unfortunately data prior to 1965 was inconsistent and prior recessions could not be considered.
Based on the indicator hit rate at successfully flagging recessions over the last 50 years, risk scores have the following approximate probabilities of recession:
- 0-1: Low
- 2: 25% within next 18 months
- 3: 30% within next 12 months
- 4-7: 50% within next 12 months
Note that a score of 3 is not necessarily a cause for panic. After all, there are substantial rewards to be had in the lead up to recessions (averaging 19% following yield curve inversion). For the brave, staying invested until the score jumps to 4+, or until the S&P500 drops below the 200day MA, will likely yield the best returns.
Notes on use:
- use MONTHLY time period only (the economic metrics are reported monthly)
- If you want to view the risk Score (1-7) you need to set your chart axis to "Logarithmic"
Enjoy and good luck!
Open-source Skript
Ganz im Sinne von TradingView hat dieser Autor sein/ihr Script als Open-Source veröffentlicht. Auf diese Weise können nun auch andere Trader das Script rezensieren und die Funktionalität überprüfen. Vielen Dank an den Autor! Sie können das Script kostenlos verwenden, aber eine Wiederveröffentlichung des Codes unterliegt unseren Hausregeln.
Haftungsausschluss
Die Informationen und Veröffentlichungen sind nicht als Finanz-, Anlage-, Handels- oder andere Arten von Ratschlägen oder Empfehlungen gedacht, die von TradingView bereitgestellt oder gebilligt werden, und stellen diese nicht dar. Lesen Sie mehr in den Nutzungsbedingungen.