OPEN-SOURCE SCRIPT
CUSUM Peaks & Troughs with Drift
This script implements an Improved CUSUM (Cumulative Sum) Peaks & Troughs with Drift indicator. Here's a breakdown of how it works:
Input Parameters:
cusumThreshold: Threshold value for detecting peaks and troughs.
cusumDrift: Drift value used to adjust the CUSUM calculation.
movingAverageLength: Length of the moving average used as a reference for deviation calculation.
Moving Average Calculation:
Calculates the simple moving average (SMA) of the closing prices over a specified length.
Price Deviation Calculation:
Computes the deviation of the closing price from the moving average.
CUSUM Calculation with Drift:
Utilises cumulative sum (CUSUM) calculations with drift adjustment.
Tracks positive and negative deviations from the moving average, considering the specified drift value.
Peak and Trough Detection:
Detects peaks and troughs based on the predefined thresholds (cusumThreshold).
Resets the CUSUM values when peaks or troughs are detected.
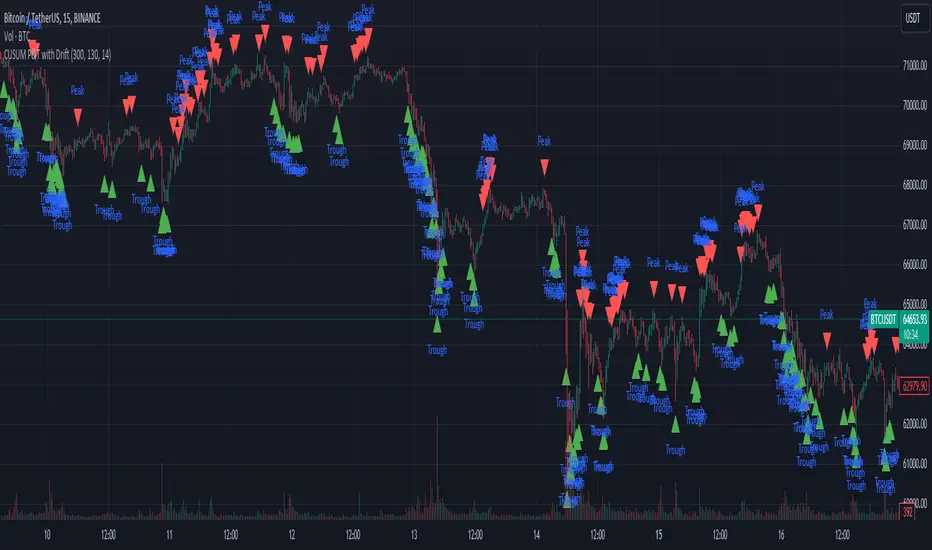
Plotting:
Plots shapes (triangles) above the bars for peaks and below the bars for troughs.
Optionally, you can uncomment the lines to visualise the CUSUM values and the zero line for reference.
This indicator helps identify potential turning points or reversals in the price action by detecting peaks (high points) and troughs (low points) in the cumulative sum of price deviations from the moving average, considering drift to adapt to underlying trends in the data.
Input Parameters:
cusumThreshold: Threshold value for detecting peaks and troughs.
cusumDrift: Drift value used to adjust the CUSUM calculation.
movingAverageLength: Length of the moving average used as a reference for deviation calculation.
Moving Average Calculation:
Calculates the simple moving average (SMA) of the closing prices over a specified length.
Price Deviation Calculation:
Computes the deviation of the closing price from the moving average.
CUSUM Calculation with Drift:
Utilises cumulative sum (CUSUM) calculations with drift adjustment.
Tracks positive and negative deviations from the moving average, considering the specified drift value.
Peak and Trough Detection:
Detects peaks and troughs based on the predefined thresholds (cusumThreshold).
Resets the CUSUM values when peaks or troughs are detected.
Plotting:
Plots shapes (triangles) above the bars for peaks and below the bars for troughs.
Optionally, you can uncomment the lines to visualise the CUSUM values and the zero line for reference.
This indicator helps identify potential turning points or reversals in the price action by detecting peaks (high points) and troughs (low points) in the cumulative sum of price deviations from the moving average, considering drift to adapt to underlying trends in the data.
Open-source Skript
Ganz im Sinne von TradingView hat dieser Autor sein/ihr Script als Open-Source veröffentlicht. Auf diese Weise können nun auch andere Trader das Script rezensieren und die Funktionalität überprüfen. Vielen Dank an den Autor! Sie können das Script kostenlos verwenden, aber eine Wiederveröffentlichung des Codes unterliegt unseren Hausregeln.
Haftungsausschluss
Die Informationen und Veröffentlichungen sind nicht als Finanz-, Anlage-, Handels- oder andere Arten von Ratschlägen oder Empfehlungen gedacht, die von TradingView bereitgestellt oder gebilligt werden, und stellen diese nicht dar. Lesen Sie mehr in den Nutzungsbedingungen.