OPEN-SOURCE SCRIPT
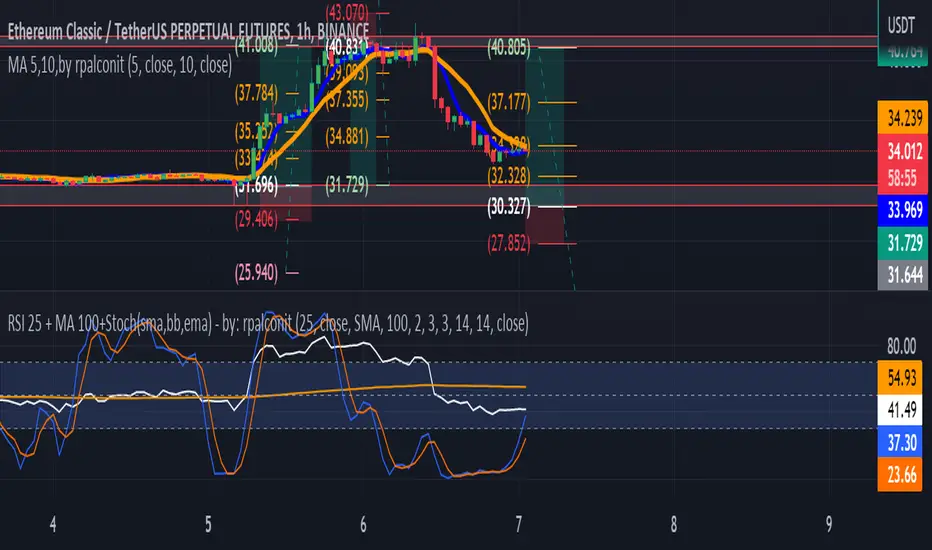
RSI 25 + MA 100+Stoch(sma,bb,ema) - by: rpalconit
Hello everyone,
This indicator uses RSI 25 + MA 100 + Stoch(sma,bb,ema to show buy and sell signals.
Signal Features:
• Buy Signal: It gives a buy signal when the RSI Length 25 bend upward below middle/lower bands and crosses MA 100 .
• Sell Signal: It gives a buy signal when the RSI Length 25 bend downward above middle/upper bands and crosses MA 100 .
• .
• Strong Buy Signal: It gives a strong buy signal when the RSI Length 25 bend upward below lower band and within overbought area of 30
• Storng Sell Signal: It gives a strong sell signal when the RSI Length 25 bend downward below lower band and within oversold area of 70.
You can change RSI length in any of your preference. And the Moving average you can select them from the list such as Simple Moving Average(SMA), Bollinger Bands( BB)and Exponential Moving Average (EMA.
In addition it includes momentum indicator like Stochastic RSI for more confirmation.
Details about the indicator
INPUTS
Time Frame
• Time Frames Chart: You can select your preferred timeframe at the dropdown list.
Relative Strength Index Settings
RSI Length: You can choose your preferred RSI length at the dropdown list.
RSI Source: You can choose your preferred RSI source at the dropdown list.
MA Setting:
1. MA Type: You can choose your preferred MA Type at the dropdown list.
2. MA Length: You can choose your preferred MA Length at the dropdown list.
3. stdDiv: You can choose your preferred the dropdown list.
Stochastic RSI gives you an idea about momentum if reach to the oversold and overbought areas.
Best regards,
ruelpalconit
Open-source Skript
Ganz im Sinne von TradingView hat dieser Autor sein/ihr Script als Open-Source veröffentlicht. Auf diese Weise können nun auch andere Trader das Script rezensieren und die Funktionalität überprüfen. Vielen Dank an den Autor! Sie können das Script kostenlos verwenden, aber eine Wiederveröffentlichung des Codes unterliegt unseren Hausregeln.
Haftungsausschluss
Die Informationen und Veröffentlichungen sind nicht als Finanz-, Anlage-, Handels- oder andere Arten von Ratschlägen oder Empfehlungen gedacht, die von TradingView bereitgestellt oder gebilligt werden, und stellen diese nicht dar. Lesen Sie mehr in den Nutzungsbedingungen.