OPEN-SOURCE SCRIPT
Layering Plots
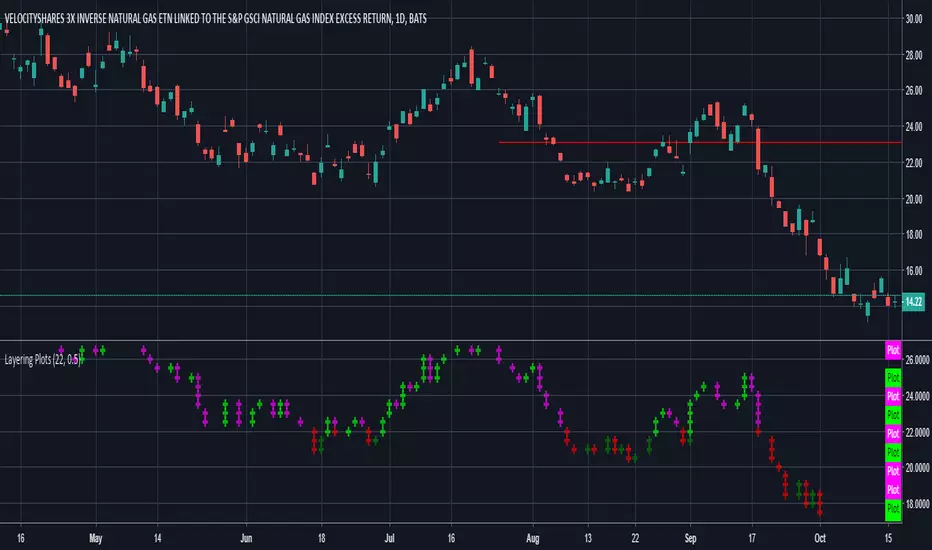
Lets say you want to layer into a position and you'd like to see it turn around. The study lets you set a baseline and increments above and below that baseline. A green cross is plotted ever time the price crosses above one of the increments, and red when crossing below that increment.
In the example I set the baseline to $22.1, and Layer increments to $0.50. So it will plot a cross every 50 cents above and below the baseline. This can be used on any chart period (daily, hourly, 5min...), but is limited to 9 layers above and below the baseline.
NOTES...
Lime = when price crosses above a layer that is above the baseline
Green = when price crosses above a layer below the baseline
Pink = when price crosses below a layer that is above the baseline
Red = when price crosses below a layer below the baseline
IMPORTANT...
This does not plot sometimes. I'm using a crossover crossunder function, and if a candle gaps open below and ends above a layer, this will not plot. It is not in error, just the way that function works. I will be looking to improve this study, wanted to share what I have for now.
Open-source Skript
Ganz im Sinne von TradingView hat dieser Autor sein/ihr Script als Open-Source veröffentlicht. Auf diese Weise können nun auch andere Trader das Script rezensieren und die Funktionalität überprüfen. Vielen Dank an den Autor! Sie können das Script kostenlos verwenden, aber eine Wiederveröffentlichung des Codes unterliegt unseren Hausregeln.
Haftungsausschluss
Die Informationen und Veröffentlichungen sind nicht als Finanz-, Anlage-, Handels- oder andere Arten von Ratschlägen oder Empfehlungen gedacht, die von TradingView bereitgestellt oder gebilligt werden, und stellen diese nicht dar. Lesen Sie mehr in den Nutzungsbedingungen.