OPEN-SOURCE SCRIPT
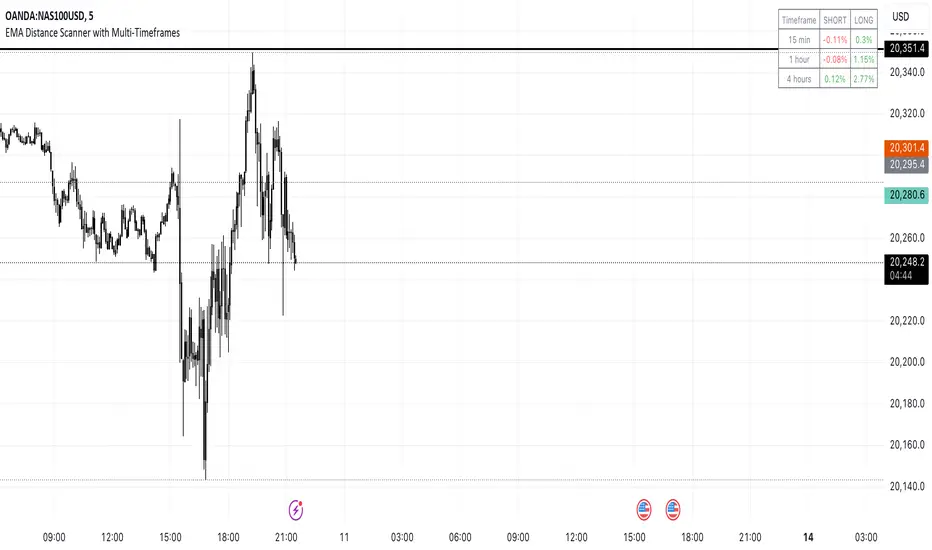
EMA Distance Scanner with Multi-Timeframes

This indicator was created for personal use because I wanted to see, within the five-minute time frame, what is happening with the 15-minute, 1 hour, and 4 hour EMA9 and EMA200.
When the number is green, we are above the EMA value, and when it is red, we are below it. This also helps to get a clearer picture of the short- and long-term trends. When the number is close, within 0.00-0.01%, it turns blue, indicating a potential support level. You can also change the EMA values to your preference in the settings.
Hopefully, this will be helpful for you as well.
Open-source Skript
Ganz im Sinne von TradingView hat dieser Autor sein/ihr Script als Open-Source veröffentlicht. Auf diese Weise können nun auch andere Trader das Script rezensieren und die Funktionalität überprüfen. Vielen Dank an den Autor! Sie können das Script kostenlos verwenden, aber eine Wiederveröffentlichung des Codes unterliegt unseren Hausregeln.
Haftungsausschluss
Die Informationen und Veröffentlichungen sind nicht als Finanz-, Anlage-, Handels- oder andere Arten von Ratschlägen oder Empfehlungen gedacht, die von TradingView bereitgestellt oder gebilligt werden, und stellen diese nicht dar. Lesen Sie mehr in den Nutzungsbedingungen.