OPEN-SOURCE SCRIPT
Diodato 'All Stars Align' Signal
Description:
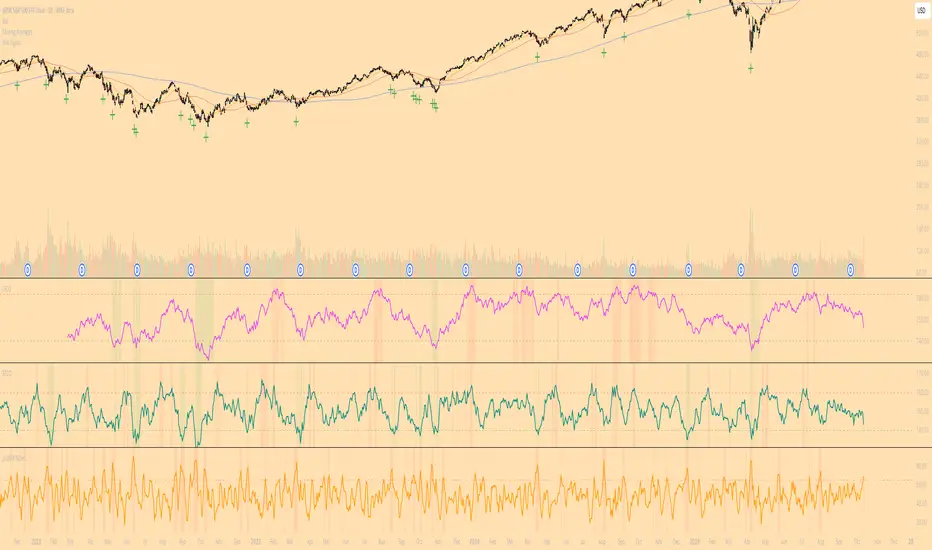
This indicator is an overlay that plots the "All Stars Align" buy signal from Chris Diodato's 2019 CMT paper, "Making The Most Of Panic." It is designed to identify high-conviction, short-term buying opportunities by requiring a confluence of both price-based momentum and market-internal weakness.
What It Is
This script works entirely in the background, calculating three separate indicators: the 14-day Slow Stochastic, the Short-Term Capitulation Oscillator (STCO), and the 3-DMA of % Declining Issues. It then plots a signal directly on the main price chart only when the specific "All Stars Align" conditions are met.
How to Interpret
A green cross (+) appears below a price bar when a high-conviction buy signal is generated. This signal triggers only when two primary conditions are true:
The 14-day Slow Stochastic is in "oversold" territory (e.g., below 20).
AND at least one of the market internal indicators shows a state of panic:
Either the STCO is oversold (e.g., below 140).
Or the 3-DMA % Declines shows a panic spike (e.g., above 65).
This confluence signifies a potential exhaustion of sellers and can mark an opportune moment to look for entries.
Settings
Trigger Thresholds: You can customize the exact levels that define an "oversold" or "panic" state for each of the three underlying indicators.
Data Sources: Allows toggling the use of "Unchanged" data for the background calculations.
Stochastic Settings: You can adjust the parameters for the Slow Stochastic calculation.
Open-source Skript
Ganz im Sinne von TradingView hat dieser Autor sein/ihr Script als Open-Source veröffentlicht. Auf diese Weise können nun auch andere Trader das Script rezensieren und die Funktionalität überprüfen. Vielen Dank an den Autor! Sie können das Script kostenlos verwenden, aber eine Wiederveröffentlichung des Codes unterliegt unseren Hausregeln.
Haftungsausschluss
Die Informationen und Veröffentlichungen sind nicht als Finanz-, Anlage-, Handels- oder andere Arten von Ratschlägen oder Empfehlungen gedacht, die von TradingView bereitgestellt oder gebilligt werden, und stellen diese nicht dar. Lesen Sie mehr in den Nutzungsbedingungen.