OPEN-SOURCE SCRIPT
bows
//version=5
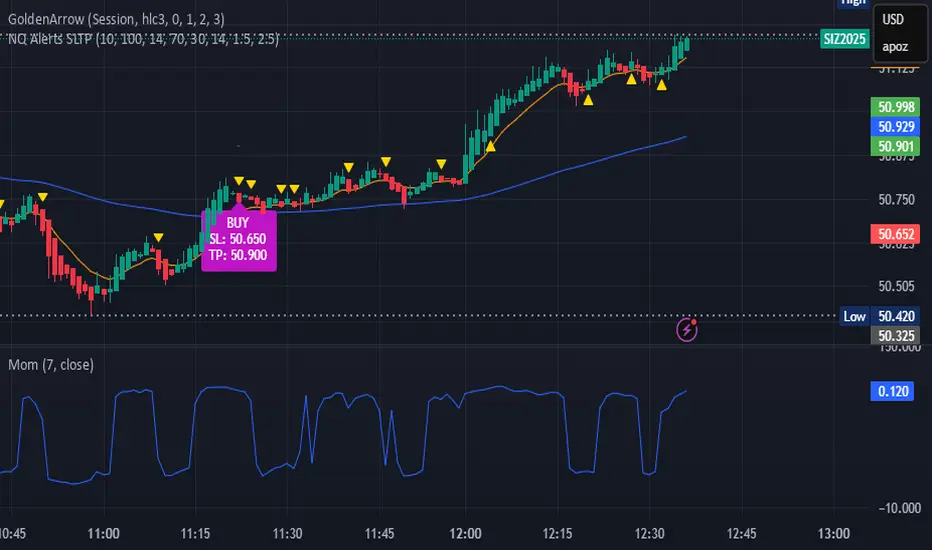
indicator("NQ EMA+RSI+ATR Alerts with SL/TP", overlay=true, shorttitle="NQ Alerts SLTP")
// === Inputs ===a
fastLen = input.int(9, "Fast EMA", minval=1)
slowLen = input.int(21, "Slow EMA", minval=1)
rsiLen = input.int(14, "RSI Length", minval=1)
rsiLongMax = input.int(70, "Max RSI to allow LONG", minval=50, maxval=90)
rsiShortMin = input.int(30, "Min RSI to allow SHORT", minval=10, maxval=50)
atrLen = input.int(14, "ATR Length", minval=1)
atrMultSL = input.float(1.5, "ATR Stop-Loss Multiplier", step=0.1)
atrMultTP = input.float(2.5, "ATR Take-Profit Multiplier", step=0.1)
// === Indicator calculations ===
price = close
fastEMA = ta.ema(price, fastLen)
slowEMA = ta.ema(price, slowLen)
rsiVal = ta.rsi(price, rsiLen)
atr = ta.atr(atrLen)
// === Entry signals ===
longSignal = ta.crossover(fastEMA, slowEMA) and rsiVal < rsiLongMax
shortSignal = ta.crossunder(fastEMA, slowEMA) and rsiVal > rsiShortMin
// === SL/TP Levels ===
longSL = price - atr * atrMultSL
longTP = price + atr * atrMultTP
shortSL = price + atr * atrMultSL
shortTP = price - atr * atrMultTP
// === Plotting ===
plot(fastEMA, color=color.orange, title="Fast EMA")
plot(slowEMA, color=color.blue, title="Slow EMA")
plotshape(longSignal, title="Buy Signal", style=shape.triangleup, color=color.new(color.green, 0), location=location.belowbar, size=size.tiny)
plotshape(shortSignal, title="Sell Signal", style=shape.triangledown, color=color.new(color.red, 0), location=location.abovebar, size=size.tiny)
// Optional visualization of SL/TP
plot(longSignal ? longSL : na, "Long Stop-Loss", color=color.new(color.red, 50), style=plot.style_linebr)
plot(longSignal ? longTP : na, "Long Take-Profit", color=color.new(color.green, 50), style=plot.style_linebr)
plot(shortSignal ? shortSL : na, "Short Stop-Loss", color=color.new(color.red, 50), style=plot.style_linebr)
plot(shortSignal ? shortTP : na, "Short Take-Profit", color=color.new(color.green, 50), style=plot.style_linebr)
// === Alerts with SL/TP info ===
alertcondition(longSignal, title="BUY Signal",
message="BUY Alert — NQ LONG: Entry @ {{close}} | SL: {{plot_1}} | TP: {{plot_2}} | {{ticker}}")
alertcondition(shortSignal, title="SELL Signal",
message="SELL Alert — NQ SHORT: Entry @ {{close}} | SL: {{plot_3}} | TP: {{plot_4}} | {{ticker}}")
// === Visual labels ===
if (longSignal)
label.new(bar_index, low, "BUY\nSL: " + str.tostring(longSL, format.mintick) + "\nTP: " + str.tostring(longTP, format.mintick),
style=label.style_label_up, color=color.new(#be14c4, 0), textcolor=color.white)
if (shortSignal)
label.new(bar_index, high, "SELL\nSL: " + str.tostring(shortSL, format.mintick) + "\nTP: " + str.tostring(shortTP, format.mintick),
style=label.style_label_down, color=color.new(color.red, 0), textcolor=color.white)
Open-source Skript
Ganz im Sinne von TradingView hat dieser Autor sein/ihr Script als Open-Source veröffentlicht. Auf diese Weise können nun auch andere Trader das Script rezensieren und die Funktionalität überprüfen. Vielen Dank an den Autor! Sie können das Script kostenlos verwenden, aber eine Wiederveröffentlichung des Codes unterliegt unseren Hausregeln.
Haftungsausschluss
Die Informationen und Veröffentlichungen sind nicht als Finanz-, Anlage-, Handels- oder andere Arten von Ratschlägen oder Empfehlungen gedacht, die von TradingView bereitgestellt oder gebilligt werden, und stellen diese nicht dar. Lesen Sie mehr in den Nutzungsbedingungen.