OPEN-SOURCE SCRIPT
Aktualisiert even_better_sinewave_mod

Description:
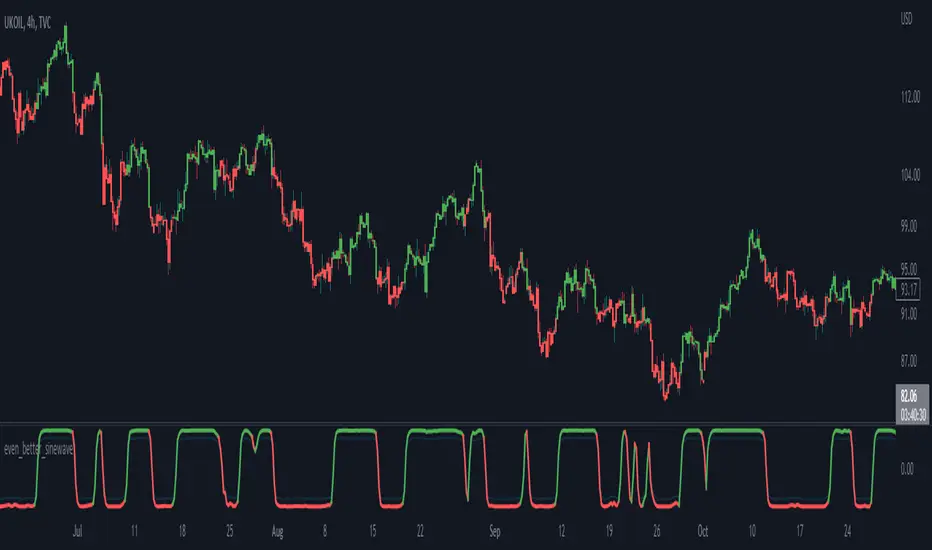
Even better sinewave was an indicator developed by John F. Ehlers (see Cycle Analytics for Trader, pg. 159), in which improvement to cycle measurements completely relies on strong normalization of the waveform. The indicator aims to create an artificially predictive indicator by transferring the cyclic data swings into a sine wave. In this indicator, the modified is on the weighted moving average as a smoothing function, instead of using the super smoother, aim to be more adaptive, and the default length is set to 55 bars.
Sinewave
smoothing = (7*hp + 6*hp_1 + 5*hp_2+ 4*hp_3 + 3*hp_4 + 2*hp5 + hp_6) /28
normalize = wave/sqrt(power)
Notes:
- sinewave indicator crossing over -0.9 is considered to beginning of the cycle while crossing under 0.9 is considered as an end of the cycle
- line color turns to green considered as a confirmation of an uptrend, while turns red as a confirmation of a downtrend
- confidence of using indicator will be much in confirmation paired with another indicator such dynamic trendline e.g. moving average
- as cited within Ehlers book Cycle Analytic for Traders, the indicator will be useful if the satisfied market cycle mode and the period of the dominant cycle must be estimated with reasonable accuracy
Other Example
Versionshinweise
adjusting the high-pass filter, and re-arrange the color conditionVersionshinweise
update plot, adding create an alert and barcolor optionsOpen-source Skript
Ganz im Sinne von TradingView hat dieser Autor sein/ihr Script als Open-Source veröffentlicht. Auf diese Weise können nun auch andere Trader das Script rezensieren und die Funktionalität überprüfen. Vielen Dank an den Autor! Sie können das Script kostenlos verwenden, aber eine Wiederveröffentlichung des Codes unterliegt unseren Hausregeln.
Haftungsausschluss
Die Informationen und Veröffentlichungen sind nicht als Finanz-, Anlage-, Handels- oder andere Arten von Ratschlägen oder Empfehlungen gedacht, die von TradingView bereitgestellt oder gebilligt werden, und stellen diese nicht dar. Lesen Sie mehr in den Nutzungsbedingungen.
Open-source Skript
Ganz im Sinne von TradingView hat dieser Autor sein/ihr Script als Open-Source veröffentlicht. Auf diese Weise können nun auch andere Trader das Script rezensieren und die Funktionalität überprüfen. Vielen Dank an den Autor! Sie können das Script kostenlos verwenden, aber eine Wiederveröffentlichung des Codes unterliegt unseren Hausregeln.
Haftungsausschluss
Die Informationen und Veröffentlichungen sind nicht als Finanz-, Anlage-, Handels- oder andere Arten von Ratschlägen oder Empfehlungen gedacht, die von TradingView bereitgestellt oder gebilligt werden, und stellen diese nicht dar. Lesen Sie mehr in den Nutzungsbedingungen.