OPEN-SOURCE SCRIPT
Moving Average Ribbon AZly
Moving Average Ribbon AZly
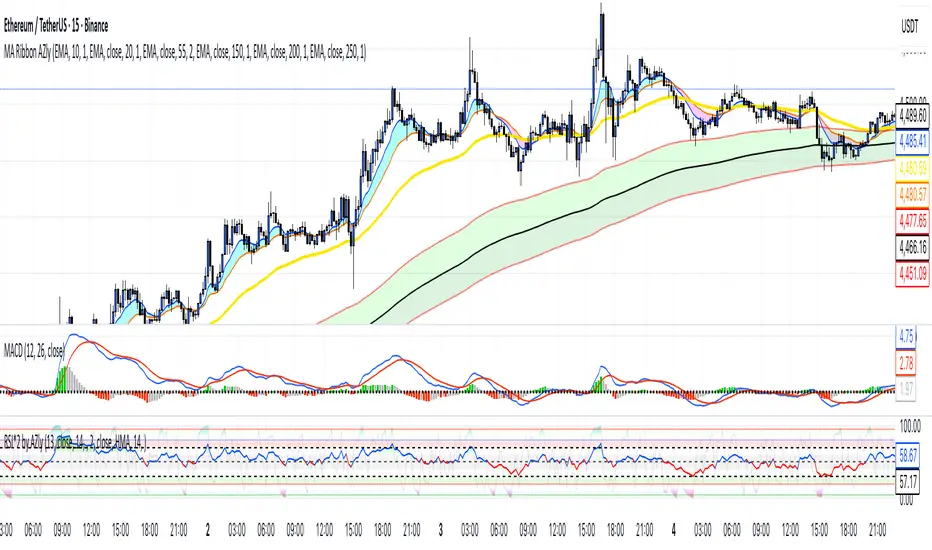
The Moving Average Ribbon AZly is a flexible trend-following indicator that visualizes market direction, strength, and transition phases using multiple customizable moving averages. It helps traders instantly identify when short-, medium-, and long-term trends align or diverge.
🔧 How it works
Up to six moving averages can be plotted, each with its own:
Type (SMA, EMA, SMMA, WMA, VWMA, or HMA)
Length, color, and width
Custom source input
The script also adds adaptive color fills between key pairs:
MA1–MA2: short-term momentum
MA4–MA5: mid-term bias
MA5–MA6: long-term trend
Bullish alignment paints green or blue ribbons, while bearish alignment turns them red or pink. The wider the ribbon, the stronger the trend separation.
💡 Why it’s better
Unlike typical ribbon indicators, this version offers full per-line customization, adaptive color fills, and a clean, high-contrast design that makes trend shifts instantly recognizable. It’s optimized for clarity, flexibility, and smooth performance on any market or timeframe.
🎯 Trading ideas
Trend confirmation: Trade only in the direction of the ribbon (green for long, red for short).
Early reversals: Watch for the fastest MAs (MA1–MA2) crossing the mid-term pair (MA4–MA5) as early signals of a trend shift.
Momentum compression: When the ribbon narrows or colors alternate rapidly, it signals consolidation or potential breakout zones.
Pullback entries: Enter trades when price bounces off the outer ribbon layer in the direction of the dominant trend.
Multi-timeframe use: Combine with a higher timeframe ribbon to confirm overall market bias.
📊 Recommended use
Works on all markets and timeframes. Ideal for trend-following, swing trading, and visual confirmation of price structure.
Open-source Skript
Ganz im Sinne von TradingView hat dieser Autor sein/ihr Script als Open-Source veröffentlicht. Auf diese Weise können nun auch andere Trader das Script rezensieren und die Funktionalität überprüfen. Vielen Dank an den Autor! Sie können das Script kostenlos verwenden, aber eine Wiederveröffentlichung des Codes unterliegt unseren Hausregeln.
Haftungsausschluss
Die Informationen und Veröffentlichungen sind nicht als Finanz-, Anlage-, Handels- oder andere Arten von Ratschlägen oder Empfehlungen gedacht, die von TradingView bereitgestellt oder gebilligt werden, und stellen diese nicht dar. Lesen Sie mehr in den Nutzungsbedingungen.