OPEN-SOURCE SCRIPT
Aktualisiert ST Fractals With Percentage Difference

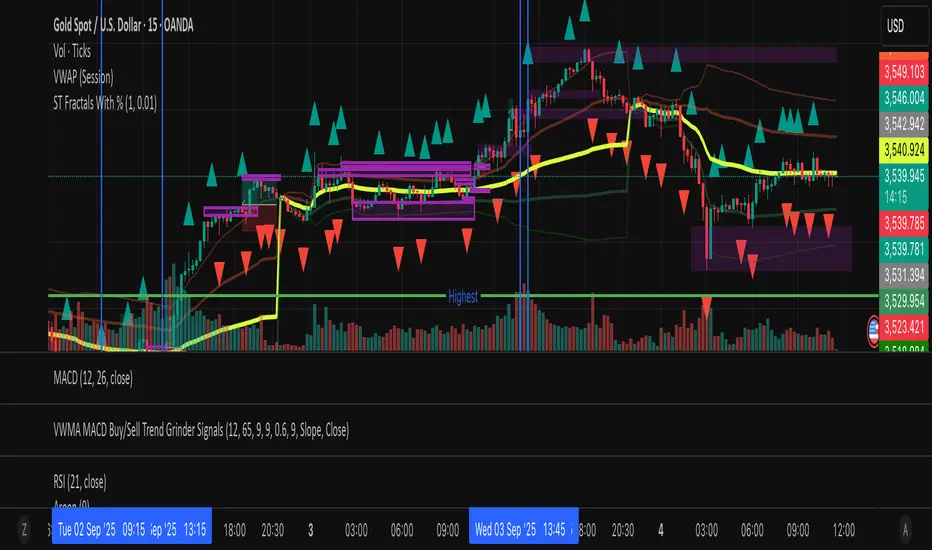
This indicator identifies Williams Fractals on your price chart, helping traders spot potential reversal points and short-term highs and lows. This changes default value to 1 and adds percentage difference similar to ST Fractals option on MT5
How It Works:
Up Fractals (▲): Plotted above a candle that is higher than its surrounding candles — a potential short-term top.
Down Fractals (▼): Plotted below a candle that is lower than its surrounding candles — a potential short-term bottom.
Fractals are only drawn if the price difference from the next candle exceeds a minimum percentage, to avoid signals caused by small fluctuations.
The script ensures that both up and down fractals never appear on the same candle, keeping your chart clear.
Settings:
Periods (n): Determines how many candles before and after are considered to find a fractal. Default: 2.
Min % Difference: Filters out insignificant fractals by requiring a minimum difference from the next candle. Default: 0.01%.
Usage Tips:
Can be used to identify support and resistance levels.
Often combined with trend indicators or moving averages to confirm reversals.
Works best in markets with clear trends or volatility, rather than very flat markets.
Visuals:
Green triangle ▲ → Up Fractal (potential top)
Red triangle ▼ → Down Fractal (potential bottom)
Versionshinweise
change the short nameVersionshinweise
change default inputOpen-source Skript
Ganz im Sinne von TradingView hat dieser Autor sein/ihr Script als Open-Source veröffentlicht. Auf diese Weise können nun auch andere Trader das Script rezensieren und die Funktionalität überprüfen. Vielen Dank an den Autor! Sie können das Script kostenlos verwenden, aber eine Wiederveröffentlichung des Codes unterliegt unseren Hausregeln.
Haftungsausschluss
Die Informationen und Veröffentlichungen sind nicht als Finanz-, Anlage-, Handels- oder andere Arten von Ratschlägen oder Empfehlungen gedacht, die von TradingView bereitgestellt oder gebilligt werden, und stellen diese nicht dar. Lesen Sie mehr in den Nutzungsbedingungen.
Open-source Skript
Ganz im Sinne von TradingView hat dieser Autor sein/ihr Script als Open-Source veröffentlicht. Auf diese Weise können nun auch andere Trader das Script rezensieren und die Funktionalität überprüfen. Vielen Dank an den Autor! Sie können das Script kostenlos verwenden, aber eine Wiederveröffentlichung des Codes unterliegt unseren Hausregeln.
Haftungsausschluss
Die Informationen und Veröffentlichungen sind nicht als Finanz-, Anlage-, Handels- oder andere Arten von Ratschlägen oder Empfehlungen gedacht, die von TradingView bereitgestellt oder gebilligt werden, und stellen diese nicht dar. Lesen Sie mehr in den Nutzungsbedingungen.