OPEN-SOURCE SCRIPT
Aktualisiert Indices Tracker and VOLD-Market Breadth
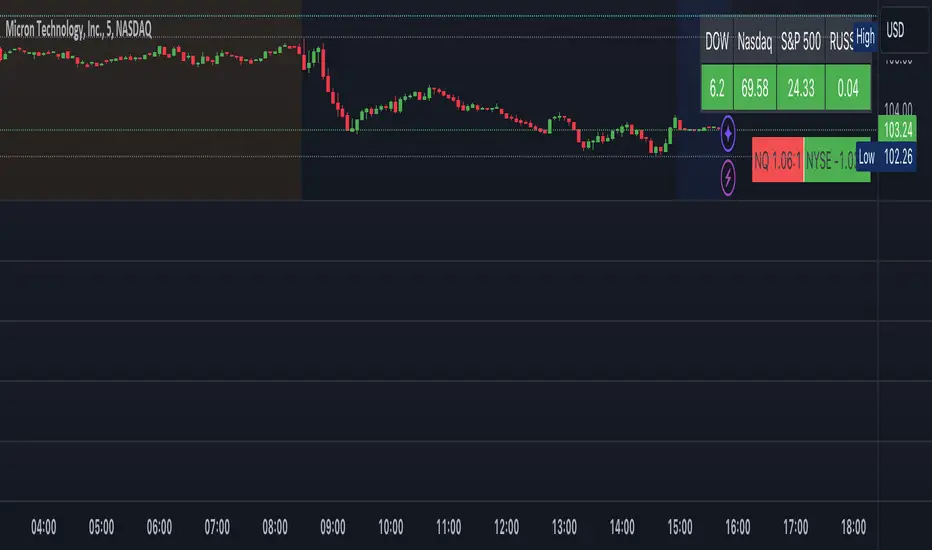
This is an overlay displaying DOW, Nasdaq and S&P performance for the day in real-time along with NQ and NYSE market breadth display.
Overview of the Script:
The Dow, Nasdaq, S&P Tracker section is at the top, displaying the current index values, changes, and colors.
The VOLD-Market Breadth section is below, providing the market breadth information.
Helpful to get a market view while trading stocks or options directionally.
Overview of the Script:
The Dow, Nasdaq, S&P Tracker section is at the top, displaying the current index values, changes, and colors.
The VOLD-Market Breadth section is below, providing the market breadth information.
Helpful to get a market view while trading stocks or options directionally.
Versionshinweise
Basic script overlaying US market indices (Dow, Nasdaq, S&P and Russel) on the chart along with market breadth information of NQ and NYSE.Ready reference while exploring other stocks for trading.
Open-source Skript
Ganz im Sinne von TradingView hat dieser Autor sein/ihr Script als Open-Source veröffentlicht. Auf diese Weise können nun auch andere Trader das Script rezensieren und die Funktionalität überprüfen. Vielen Dank an den Autor! Sie können das Script kostenlos verwenden, aber eine Wiederveröffentlichung des Codes unterliegt unseren Hausregeln.
Haftungsausschluss
Die Informationen und Veröffentlichungen sind nicht als Finanz-, Anlage-, Handels- oder andere Arten von Ratschlägen oder Empfehlungen gedacht, die von TradingView bereitgestellt oder gebilligt werden, und stellen diese nicht dar. Lesen Sie mehr in den Nutzungsbedingungen.