OPEN-SOURCE SCRIPT
Corrected QWMA (Quadratic Weighted Moving Average) [Loxx]
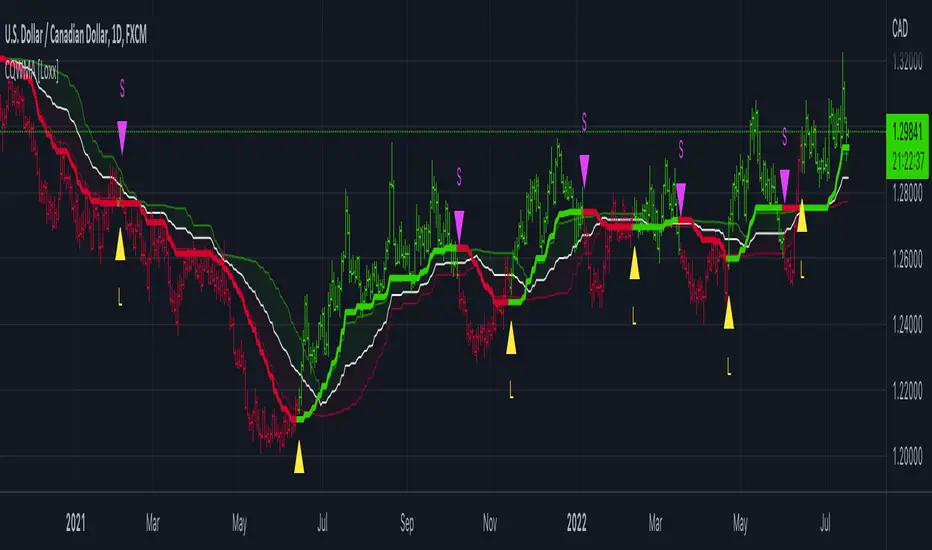
Corrected QWMA (Quadratic Weighted Moving Average) [Loxx] is the "corrected" version of QWMA. There are other attempts on TradingView to create the QWMA, this is the correct version with weighting applied to the lookback period.
"Correcting" is a process where the value of the average is checked for the significance (how big is it) of change. For that, a standard deviation of a change is used and if the change is "not significant enough", then the change is ignored. Because of this, the average starts to have that "step like" value, but in any case, it should not be mixed with the step average type. The corrected average is different.
The correction period can be used to have different types of calculations:
Color combinations:
Included:
"Correcting" is a process where the value of the average is checked for the significance (how big is it) of change. For that, a standard deviation of a change is used and if the change is "not significant enough", then the change is ignored. Because of this, the average starts to have that "step like" value, but in any case, it should not be mixed with the step average type. The corrected average is different.
The correction period can be used to have different types of calculations:
- If the "correction" period is set to < 0, then there is no correction made (in that case the value is exactly the same as original qwma)
- If the "correction" period is set to 0, then the "correction" period is the same as qma period
- If it is set to any other value, that period is used
Color combinations:
- Middle: color (and alerts) on slope change
- Levels: (and alerts) on outer levels cross
- QWMA: (and alerts) on middle level cross
Included:
- Bar coloring
- Signals
- Alerts
Open-source Skript
Ganz im Sinne von TradingView hat dieser Autor sein/ihr Script als Open-Source veröffentlicht. Auf diese Weise können nun auch andere Trader das Script rezensieren und die Funktionalität überprüfen. Vielen Dank an den Autor! Sie können das Script kostenlos verwenden, aber eine Wiederveröffentlichung des Codes unterliegt unseren Hausregeln.
Public Telegram Group, t.me/algxtrading_public
VIP Membership Info: patreon.com/algxtrading/membership
VIP Membership Info: patreon.com/algxtrading/membership
Haftungsausschluss
Die Informationen und Veröffentlichungen sind nicht als Finanz-, Anlage-, Handels- oder andere Arten von Ratschlägen oder Empfehlungen gedacht, die von TradingView bereitgestellt oder gebilligt werden, und stellen diese nicht dar. Lesen Sie mehr in den Nutzungsbedingungen.