OPEN-SOURCE SCRIPT
Aktualisiert Volume Profile per day with support/resistance lines
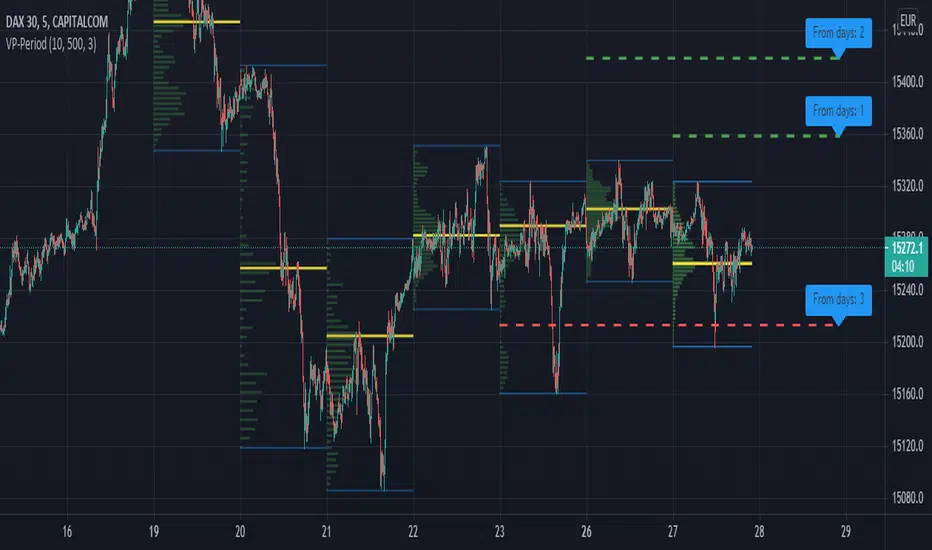
This indicator shows the volume profile by daily blocks and draws on the chart the support or resistance lines produced by the previous volume profile block. A support line will be created if in the previous block, the VPOC line was closer to the lowest price line of that block. This support line will be placed below the VPOC line, at a distance equal to the difference between the highest price of that block and the VPOC price. For the case of the resistance line, the logic applied is analogous.
These support and resistance lines are introduced because, according to the Gaussian bell, the VPOC is likely to be located in the middle, and these deviations can be used to trace support and resistance.
In addition, the indicator includes the following features:
- Change the colors of all plotted lines.
- Define the number of daily blocks to be displayed.
- Define the resolution when calculating the volume of each candle.
- Define the number of support/resistance lines to be displayed.
- Highest and lowest price lines, as well as vpoc line, volume histogram and support and resistance lines.
- Display or not, the vpoc line and the volume histogram.
The calculations performed by the script improve if the candles used are of a lower timeframe. This indicator has been tested in several markets, including cryptos, CFDs, Forex and Indices.
Versionshinweise
Added offset for labels and for support and resistance lines so that they do not overlap with the bars on the chart.Versionshinweise
It is now possible to show and hide chart lines and labels separately.Open-source Skript
Ganz im Sinne von TradingView hat dieser Autor sein/ihr Script als Open-Source veröffentlicht. Auf diese Weise können nun auch andere Trader das Script rezensieren und die Funktionalität überprüfen. Vielen Dank an den Autor! Sie können das Script kostenlos verwenden, aber eine Wiederveröffentlichung des Codes unterliegt unseren Hausregeln.
Haftungsausschluss
Die Informationen und Veröffentlichungen sind nicht als Finanz-, Anlage-, Handels- oder andere Arten von Ratschlägen oder Empfehlungen gedacht, die von TradingView bereitgestellt oder gebilligt werden, und stellen diese nicht dar. Lesen Sie mehr in den Nutzungsbedingungen.
Open-source Skript
Ganz im Sinne von TradingView hat dieser Autor sein/ihr Script als Open-Source veröffentlicht. Auf diese Weise können nun auch andere Trader das Script rezensieren und die Funktionalität überprüfen. Vielen Dank an den Autor! Sie können das Script kostenlos verwenden, aber eine Wiederveröffentlichung des Codes unterliegt unseren Hausregeln.
Haftungsausschluss
Die Informationen und Veröffentlichungen sind nicht als Finanz-, Anlage-, Handels- oder andere Arten von Ratschlägen oder Empfehlungen gedacht, die von TradingView bereitgestellt oder gebilligt werden, und stellen diese nicht dar. Lesen Sie mehr in den Nutzungsbedingungen.