OPEN-SOURCE SCRIPT
DVRSI Premium (Força + EMA50 + Volume) - by Patrick
Best uses
Entry confirmation: Avoids trading based only on RSI or moving averages, requiring multiple criteria (strength, trend, and volume). May require that you zoom in for best views.
Automatic alerts: Useful for traders who cannot monitor charts constantly — alerts notify when a confirmed signal appears.
How the script works
Inputs
RSI with 21 periods (smoothed RSI to reduce noise)
20‑period moving average of volume.
50‑period exponential moving average.
Calculates the size of the candle body, compares it with the average body size
Defines a candle as “strong” if:
Body > 1.5 × average body size.
Volume > 1.3 × average volume.
Trend and strength conditions
crossUp → smoothed RSI crosses above the 50 line.
crossDown → smoothed RSI crosses below the 50 line.
volumeHigh → volume above average.
upTrend → price above EMA50.
downTrend → price below EMA50.
Signals
LONG (buy): RSI crosses above 50 + high volume + price above EMA50 + strong candle.
SHORT (sell): RSI crosses below 50 + high volume + price below EMA50 + strong candle.
Alerts - Creates automatic alerts for confirmed LONG and SHORT signals, with descriptive messages.
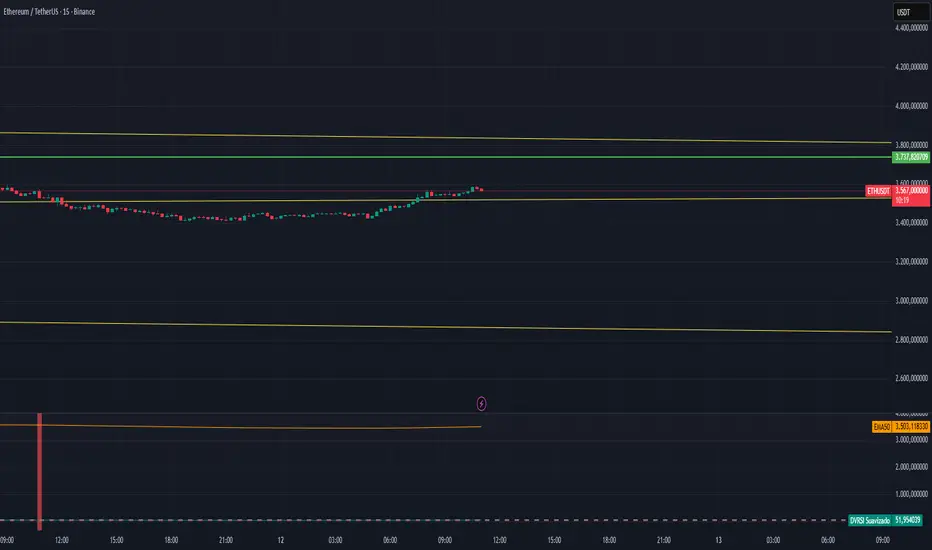
Visualization - Plots Smoothed RSI, EMA50 nad Horizontal lines (40, 50, 60) as reference zones.
Chart background changes color:
Green when there is a LONG signal.
Red when there is a SHORT signal.
Entry confirmation: Avoids trading based only on RSI or moving averages, requiring multiple criteria (strength, trend, and volume). May require that you zoom in for best views.
Automatic alerts: Useful for traders who cannot monitor charts constantly — alerts notify when a confirmed signal appears.
How the script works
Inputs
RSI with 21 periods (smoothed RSI to reduce noise)
20‑period moving average of volume.
50‑period exponential moving average.
Calculates the size of the candle body, compares it with the average body size
Defines a candle as “strong” if:
Body > 1.5 × average body size.
Volume > 1.3 × average volume.
Trend and strength conditions
crossUp → smoothed RSI crosses above the 50 line.
crossDown → smoothed RSI crosses below the 50 line.
volumeHigh → volume above average.
upTrend → price above EMA50.
downTrend → price below EMA50.
Signals
LONG (buy): RSI crosses above 50 + high volume + price above EMA50 + strong candle.
SHORT (sell): RSI crosses below 50 + high volume + price below EMA50 + strong candle.
Alerts - Creates automatic alerts for confirmed LONG and SHORT signals, with descriptive messages.
Visualization - Plots Smoothed RSI, EMA50 nad Horizontal lines (40, 50, 60) as reference zones.
Chart background changes color:
Green when there is a LONG signal.
Red when there is a SHORT signal.
Open-source Skript
Ganz im Sinne von TradingView hat dieser Autor sein/ihr Script als Open-Source veröffentlicht. Auf diese Weise können nun auch andere Trader das Script rezensieren und die Funktionalität überprüfen. Vielen Dank an den Autor! Sie können das Script kostenlos verwenden, aber eine Wiederveröffentlichung des Codes unterliegt unseren Hausregeln.
Haftungsausschluss
Die Informationen und Veröffentlichungen sind nicht als Finanz-, Anlage-, Handels- oder andere Arten von Ratschlägen oder Empfehlungen gedacht, die von TradingView bereitgestellt oder gebilligt werden, und stellen diese nicht dar. Lesen Sie mehr in den Nutzungsbedingungen.