This is an attempt to develop alternative visualisation of financial charts. This script also makes use of new pine feature types which represents User Defined Object Types. You can refer to below documentation to understand more about this feature:
🎲 Structure of new chart components
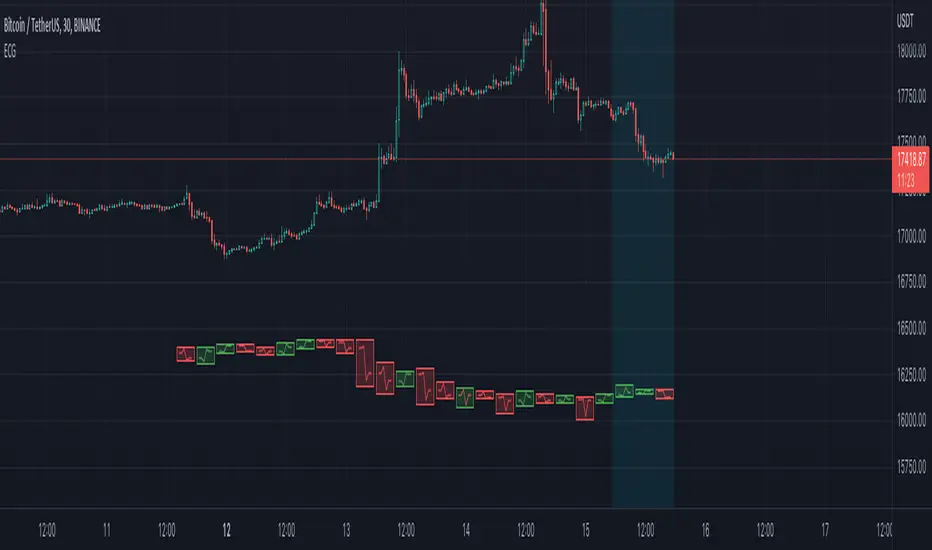
🎯Instead of candles/bars, this type of chart contains Electrocardiogram blocks which resembles the heartbeat signals on electrocardiogram.
🎯Inside each blocks there will be 5 connecting lines called the signal lines.
🎯 Color of the signal lines are determined by which among the high/low of the bar comes last. If highest part of the bar reached after reaching the lowest part of the bar, then signal lines are coloured green signifying bullish sentiment towards the end of bar. If lowest part of the bar reached after reaching the highest part of the bar, then signal lines are coloured red signifying bearish sentiment towards the end of bar.
Pictorial examples here:

🎲 Limitations with pinescript implementation
Thanks to @theheirophant for suggestion of name :)
- tradingview.com/pine-script-docs/en/v5/language/Objects.html
- tradingview.com/pine-script-reference/v5/
🎲 Structure of new chart components
🎯Instead of candles/bars, this type of chart contains Electrocardiogram blocks which resembles the heartbeat signals on electrocardiogram.
- Body color of the block is defined by the open and close prices of the bar. If close is greater than open, body is green. Otherwise, the body is painted red.
- Border color of the block is defined by the close prices of current and previous bar. If the close of current bar is greater than that of last bar, then the border color is green. Otherwise, border color is painted red.
🎯Inside each blocks there will be 5 connecting lines called the signal lines.
- open-open
- open-firstPeak(high or low of the bar whichever comes first)
- firstPeak-secondPeak(high or low of the bar whichever comes last)
- secondPeak-close
- close-close
🎯 Color of the signal lines are determined by which among the high/low of the bar comes last. If highest part of the bar reached after reaching the lowest part of the bar, then signal lines are coloured green signifying bullish sentiment towards the end of bar. If lowest part of the bar reached after reaching the highest part of the bar, then signal lines are coloured red signifying bearish sentiment towards the end of bar.
Pictorial examples here:
🎲 Limitations with pinescript implementation
- Since, pinescript can only use maximum 500 lines and each block will take 1 box and 5 lines, it is not possible to display more than 100 bars.
- Each block of new Electrocardiogram chart will take the space of 7 bars of candlestick chart. Due to this, the alignment of regular OHLC candles is not inline with the new chart type. Background highlighting is done for the part of the OHLC candles where Electrocardiogram blocks are plotted so that it helps users to map the bars manually
Thanks to @theheirophant for suggestion of name :)
Versionshinweise
Update time format logic using str.format_time
Versionshinweise
Replace for loop with for..in loop as the issue with latter is resolved. Also updated logic to calculate offset to avoid candles overlapping with standard candles.Open-source Skript
Ganz im Sinne von TradingView hat dieser Autor sein/ihr Script als Open-Source veröffentlicht. Auf diese Weise können nun auch andere Trader das Script rezensieren und die Funktionalität überprüfen. Vielen Dank an den Autor! Sie können das Script kostenlos verwenden, aber eine Wiederveröffentlichung des Codes unterliegt unseren Hausregeln.
Trial - trendoscope.io/trial
Subscribe - trendoscope.io/pricing
Blog - docs.trendoscope.io
Subscribe - trendoscope.io/pricing
Blog - docs.trendoscope.io
Haftungsausschluss
Die Informationen und Veröffentlichungen sind nicht als Finanz-, Anlage-, Handels- oder andere Arten von Ratschlägen oder Empfehlungen gedacht, die von TradingView bereitgestellt oder gebilligt werden, und stellen diese nicht dar. Lesen Sie mehr in den Nutzungsbedingungen.
Open-source Skript
Ganz im Sinne von TradingView hat dieser Autor sein/ihr Script als Open-Source veröffentlicht. Auf diese Weise können nun auch andere Trader das Script rezensieren und die Funktionalität überprüfen. Vielen Dank an den Autor! Sie können das Script kostenlos verwenden, aber eine Wiederveröffentlichung des Codes unterliegt unseren Hausregeln.
Trial - trendoscope.io/trial
Subscribe - trendoscope.io/pricing
Blog - docs.trendoscope.io
Subscribe - trendoscope.io/pricing
Blog - docs.trendoscope.io
Haftungsausschluss
Die Informationen und Veröffentlichungen sind nicht als Finanz-, Anlage-, Handels- oder andere Arten von Ratschlägen oder Empfehlungen gedacht, die von TradingView bereitgestellt oder gebilligt werden, und stellen diese nicht dar. Lesen Sie mehr in den Nutzungsbedingungen.