OPEN-SOURCE SCRIPT
Aktualisiert Supply and Demand Based Pattern [RH]

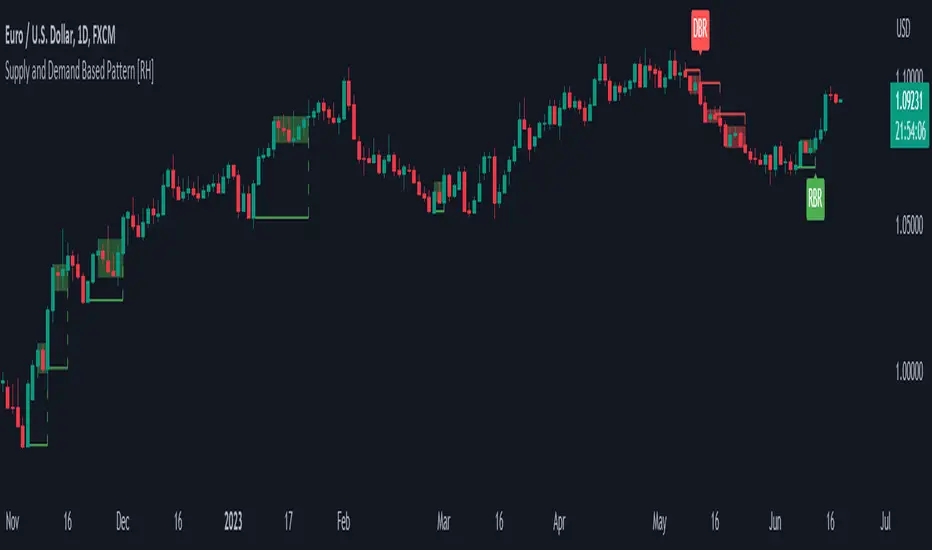
This indicator focuses on detecting RBR and DBD patterns, which signify periods of increased momentum and potential continuation or reversal of the prevailing trend.
The RBR pattern consists of a rally (upward movement), followed by a base (consolidation or retracement), and then another rally. It suggests that the upward momentum may persist and provide trading opportunities.
On the other hand, the DBD pattern comprises a drop (downward movement), followed by a base, and then another drop. It indicates that the downward momentum might continue, offering potential shorting opportunities.
Bullish(RBR) example:

Bearish(DBD) example:

1. The bullish (RBR) and bearish (DBD) patterns share the same underlying logic, only differing in their directionality.
2. For both RBR and DBD patterns, the first rise/drop can consist of one or multiple candles. However, in the case of multiple candles, all candles must exhibit a bullish nature for RBR and a bearish nature for DBD.
Example:

3. It is a prerequisite for the first rise/drop to include at least one candle with a defined percentage of health, as determined by the user.
4. The base, following the first rise/drop, may comprise one or multiple candles.
Example:

5. To maintain consistency, the base is not allowed to retrace beyond 80%, although this value can be adjusted by the user.
6. Similar to the first rise/drop, the second rise/drop in both RBR and DBD patterns can consist of one or multiple candles. However, all candles within this phase must demonstrate a bullish nature for RBR and a bearish nature for DBD.
7. Confirmation of the bullish (RBR) pattern occurs when a candle closes above the high of the first rise. Conversely, the bearish (DBD) pattern is confirmed when a candle closes below the low of the first drop.
Example:

Alerts can be set for all bullish and bearish pattern or for the first pattern in the range of similar pattern.
The RBR pattern consists of a rally (upward movement), followed by a base (consolidation or retracement), and then another rally. It suggests that the upward momentum may persist and provide trading opportunities.
On the other hand, the DBD pattern comprises a drop (downward movement), followed by a base, and then another drop. It indicates that the downward momentum might continue, offering potential shorting opportunities.
Bullish(RBR) example:
Bearish(DBD) example:
1. The bullish (RBR) and bearish (DBD) patterns share the same underlying logic, only differing in their directionality.
2. For both RBR and DBD patterns, the first rise/drop can consist of one or multiple candles. However, in the case of multiple candles, all candles must exhibit a bullish nature for RBR and a bearish nature for DBD.
Example:
3. It is a prerequisite for the first rise/drop to include at least one candle with a defined percentage of health, as determined by the user.
4. The base, following the first rise/drop, may comprise one or multiple candles.
Example:
5. To maintain consistency, the base is not allowed to retrace beyond 80%, although this value can be adjusted by the user.
6. Similar to the first rise/drop, the second rise/drop in both RBR and DBD patterns can consist of one or multiple candles. However, all candles within this phase must demonstrate a bullish nature for RBR and a bearish nature for DBD.
7. Confirmation of the bullish (RBR) pattern occurs when a candle closes above the high of the first rise. Conversely, the bearish (DBD) pattern is confirmed when a candle closes below the low of the first drop.
Example:
Alerts can be set for all bullish and bearish pattern or for the first pattern in the range of similar pattern.
Versionshinweise
Pattern's name fix.Open-source Skript
Ganz im Sinne von TradingView hat dieser Autor sein/ihr Script als Open-Source veröffentlicht. Auf diese Weise können nun auch andere Trader das Script rezensieren und die Funktionalität überprüfen. Vielen Dank an den Autor! Sie können das Script kostenlos verwenden, aber eine Wiederveröffentlichung des Codes unterliegt unseren Hausregeln.
Haftungsausschluss
Die Informationen und Veröffentlichungen sind nicht als Finanz-, Anlage-, Handels- oder andere Arten von Ratschlägen oder Empfehlungen gedacht, die von TradingView bereitgestellt oder gebilligt werden, und stellen diese nicht dar. Lesen Sie mehr in den Nutzungsbedingungen.
Open-source Skript
Ganz im Sinne von TradingView hat dieser Autor sein/ihr Script als Open-Source veröffentlicht. Auf diese Weise können nun auch andere Trader das Script rezensieren und die Funktionalität überprüfen. Vielen Dank an den Autor! Sie können das Script kostenlos verwenden, aber eine Wiederveröffentlichung des Codes unterliegt unseren Hausregeln.
Haftungsausschluss
Die Informationen und Veröffentlichungen sind nicht als Finanz-, Anlage-, Handels- oder andere Arten von Ratschlägen oder Empfehlungen gedacht, die von TradingView bereitgestellt oder gebilligt werden, und stellen diese nicht dar. Lesen Sie mehr in den Nutzungsbedingungen.