OPEN-SOURCE SCRIPT
Aktualisiert Leading MACD
The Moving Average Convergence Divergence (MACD) indicator is one of the most popular and versatile tools used by traders to identify potential buy and sell signals. It helps traders determine the strength and direction of a trend by comparing different moving averages of a security's price. The traditional MACD uses two exponential moving averages (EMAs), a fast EMA (typically 12 periods) and a slow EMA (typically 26 periods), along with a signal line (typically a 9-period EMA of the MACD line) to generate trading signals.
Our "Custom MACD with Leading Length" script for TradingView enhances the traditional MACD by introducing an additional smoothing factor called the "leading length." This customization aims to reduce noise and provide a potentially earlier indication of trend changes, making it a valuable tool for traders seeking to optimize their trading strategies.
- **Purpose:** This additional smoothing factor is designed to reduce noise and provide a potentially leading signal, enhancing the accuracy of trend identification.
## How It Works
1. **Calculate the MACD Line:**
The MACD line is calculated by subtracting the slow EMA from the fast EMA. This difference represents the convergence or divergence between the two EMAs.
2. **Calculate the Signal Line:**
The signal line is an EMA of the MACD line. This additional smoothing helps to generate clearer buy and sell signals based on crossovers with the MACD line.
3. **Calculate the Histogram:**
The histogram represents the difference between the MACD line and the signal line. It visually indicates the strength and direction of the trend. A positive histogram suggests a bullish trend, while a negative histogram indicates a bearish trend.
4. **Apply Leading Length Smoothing:**
To incorporate the leading length, the script applies a simple moving average (SMA) to both the MACD and signal lines using the leading length parameter. This additional smoothing helps to further reduce noise and potentially provides earlier signals of trend changes.
## Benefits of the Leading MACD
### Reduced Noise
The leading length parameter adds an extra layer of smoothing to the MACD and signal lines, helping to filter out market noise. This can be particularly beneficial in volatile markets, where frequent price fluctuations can generate false signals.
### Potential Early Signals
By smoothing the MACD and signal lines, the leading length can help to provide earlier indications of trend changes. This can give traders a potential edge in entering or exiting trades before the broader market reacts.
### Enhanced Trend Identification
The combination of the traditional MACD with the leading length smoothing can enhance the accuracy of trend identification. Traders can use this tool to confirm the strength and direction of trends, making it easier to make informed trading decisions.
### Versatility
The Custom MACD with Leading Length can be applied to various timeframes and asset classes, including stocks, forex, commodities, and cryptocurrencies. Its adaptability makes it a valuable tool for traders with different strategies and preferences.
## Practical Applications
### Buy Signal
A typical buy signal occurs when the MACD line crosses above the signal line. With the additional smoothing provided by the leading length, traders might receive this signal slightly earlier, allowing them to enter a long position sooner. This can be particularly advantageous in capturing the beginning of a bullish trend.
### Sell Signal
Conversely, a sell signal is generated when the MACD line crosses below the signal line. The leading length smoothing can help to provide this signal earlier, enabling traders to exit a long position or enter a short position before the trend reversal is fully recognized by the market.
### Divergence Analysis
Traders can also use the Custom MACD with Leading Length for divergence analysis. Bullish divergence occurs when the price makes a new low, but the MACD line forms a higher low. This suggests that the downward momentum is weakening, potentially leading to a bullish reversal. Bearish divergence is the opposite, where the price makes a new high, but the MACD line forms a lower high, indicating a potential bearish reversal.
### Confirmation Tool
The Custom MACD with Leading Length can be used in conjunction with other technical indicators to confirm trading signals. For example, traders might use it alongside support and resistance levels, trendlines, or other momentum indicators to validate their trade entries and exits.
## Conclusion
The Custom MACD with Leading Length is a powerful enhancement of the traditional MACD indicator. By introducing an additional smoothing factor, it aims to reduce noise and provide earlier signals of trend changes. This makes it a valuable tool for traders seeking to improve their market analysis and trading strategies.
Whether you are a day trader, swing trader, or long-term investor, the Custom MACD with Leading Length can help you make more informed decisions by offering clearer insights into market trends. Its adaptability to different timeframes and asset classes further enhances its utility, making it a versatile addition to any trader's toolkit.
Experiment with the parameters to find the optimal settings that suit your trading style and preferences. Use the Custom MACD with Leading Length to gain a deeper understanding of market dynamics and enhance your trading performance.
Versionshinweise
The Moving Average Convergence Divergence (MACD) indicator is one of the most popular and versatile tools used by traders to identify potential buy and sell signals. It helps traders determine the strength and direction of a trend by comparing different moving averages of a security's price. The traditional MACD uses two exponential moving averages (EMAs), a fast EMA (typically 12 periods) and a slow EMA (typically 26 periods), along with a signal line (typically a 9-period EMA of the MACD line) to generate trading signals.Our "Custom MACD with Leading Length" script for TradingView enhances the traditional MACD by introducing an additional smoothing factor called the "leading length." This customization aims to reduce noise and provide a potentially earlier indication of trend changes, making it a valuable tool for traders seeking to optimize their trading strategies.
- **Purpose:** This additional smoothing factor is designed to reduce noise and provide a potentially leading signal, enhancing the accuracy of trend identification.
## How It Works
1. **Calculate the MACD Line:**
The MACD line is calculated by subtracting the slow EMA from the fast EMA. This difference represents the convergence or divergence between the two EMAs.
2. **Calculate the Signal Line:**
The signal line is an EMA of the MACD line. This additional smoothing helps to generate clearer buy and sell signals based on crossovers with the MACD line.
3. **Calculate the Histogram:**
The histogram represents the difference between the MACD line and the signal line. It visually indicates the strength and direction of the trend. A positive histogram suggests a bullish trend, while a negative histogram indicates a bearish trend.
4. **Apply Leading Length Smoothing:**
To incorporate the leading length, the script applies a simple moving average (SMA) to both the MACD and signal lines using the leading length parameter. This additional smoothing helps to further reduce noise and potentially provides earlier signals of trend changes.
## Benefits of the Leading MACD
### Reduced Noise
The leading length parameter adds an extra layer of smoothing to the MACD and signal lines, helping to filter out market noise. This can be particularly beneficial in volatile markets, where frequent price fluctuations can generate false signals.
### Potential Early Signals
By smoothing the MACD and signal lines, the leading length can help to provide earlier indications of trend changes. This can give traders a potential edge in entering or exiting trades before the broader market reacts.
### Enhanced Trend Identification
The combination of the traditional MACD with the leading length smoothing can enhance the accuracy of trend identification. Traders can use this tool to confirm the strength and direction of trends, making it easier to make informed trading decisions.
### Versatility
The Custom MACD with Leading Length can be applied to various timeframes and asset classes, including stocks, forex, commodities, and cryptocurrencies. Its adaptability makes it a valuable tool for traders with different strategies and preferences.
## Practical Applications
### Buy Signal
A typical buy signal occurs when the MACD line crosses above the signal line. With the additional smoothing provided by the leading length, traders might receive this signal slightly earlier, allowing them to enter a long position sooner. This can be particularly advantageous in capturing the beginning of a bullish trend.
### Sell Signal
Conversely, a sell signal is generated when the MACD line crosses below the signal line. The leading length smoothing can help to provide this signal earlier, enabling traders to exit a long position or enter a short position before the trend reversal is fully recognized by the market.
### Divergence Analysis
Traders can also use the Custom MACD with Leading Length for divergence analysis. Bullish divergence occurs when the price makes a new low, but the MACD line forms a higher low. This suggests that the downward momentum is weakening, potentially leading to a bullish reversal. Bearish divergence is the opposite, where the price makes a new high, but the MACD line forms a lower high, indicating a potential bearish reversal.
### Confirmation Tool
The Custom MACD with Leading Length can be used in conjunction with other technical indicators to confirm trading signals. For example, traders might use it alongside support and resistance levels, trendlines, or other momentum indicators to validate their trade entries and exits.
## Conclusion
The Custom MACD with Leading Length is a powerful enhancement of the traditional MACD indicator. By introducing an additional smoothing factor, it aims to reduce noise and provide earlier signals of trend changes. This makes it a valuable tool for traders seeking to improve their market analysis and trading strategies.
Whether you are a day trader, swing trader, or long-term investor, the Custom MACD with Leading Length can help you make more informed decisions by offering clearer insights into market trends. Its adaptability to different timeframes and asset classes further enhances its utility, making it a versatile addition to any trader's toolkit.
Experiment with the parameters to find the optimal settings that suit your trading style and preferences. Use the Custom MACD with Leading Length to gain a deeper understanding of market dynamics and enhance your trading performance.
Versionshinweise
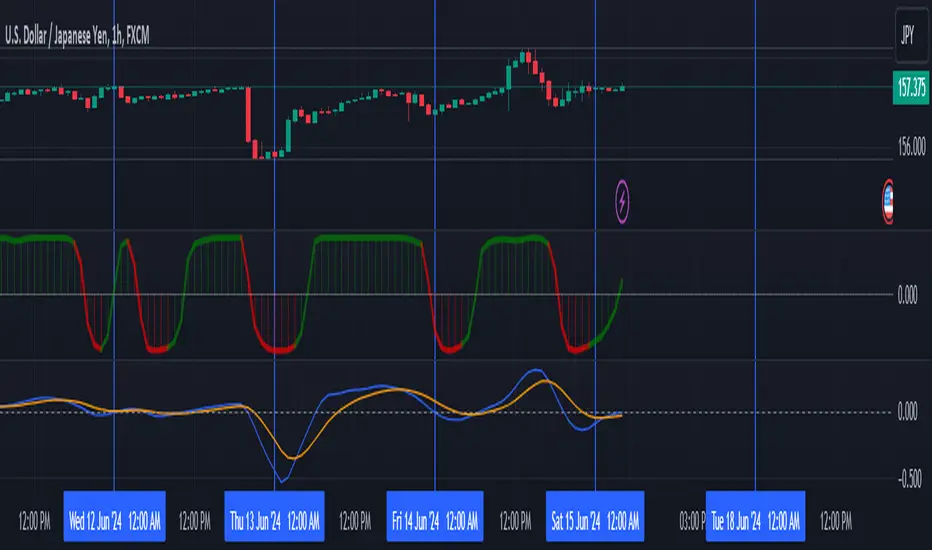
Updated Parameters. This script works best paired with sinewave, or with a normal MACD. Look for the leading MACD to crossover and confirm with normal MACD crossover to potentially take a position. Versionshinweise
Updated Parameters. Works best with a separate indicator like SineWave. Use at your own discretion. Open-source Skript
Ganz im Sinne von TradingView hat dieser Autor sein/ihr Script als Open-Source veröffentlicht. Auf diese Weise können nun auch andere Trader das Script rezensieren und die Funktionalität überprüfen. Vielen Dank an den Autor! Sie können das Script kostenlos verwenden, aber eine Wiederveröffentlichung des Codes unterliegt unseren Hausregeln.
Haftungsausschluss
Die Informationen und Veröffentlichungen sind nicht als Finanz-, Anlage-, Handels- oder andere Arten von Ratschlägen oder Empfehlungen gedacht, die von TradingView bereitgestellt oder gebilligt werden, und stellen diese nicht dar. Lesen Sie mehr in den Nutzungsbedingungen.
Open-source Skript
Ganz im Sinne von TradingView hat dieser Autor sein/ihr Script als Open-Source veröffentlicht. Auf diese Weise können nun auch andere Trader das Script rezensieren und die Funktionalität überprüfen. Vielen Dank an den Autor! Sie können das Script kostenlos verwenden, aber eine Wiederveröffentlichung des Codes unterliegt unseren Hausregeln.
Haftungsausschluss
Die Informationen und Veröffentlichungen sind nicht als Finanz-, Anlage-, Handels- oder andere Arten von Ratschlägen oder Empfehlungen gedacht, die von TradingView bereitgestellt oder gebilligt werden, und stellen diese nicht dar. Lesen Sie mehr in den Nutzungsbedingungen.