OPEN-SOURCE SCRIPT
Aktualisiert Open Lines (Daily/W/M/Q/Yearly)
Overview
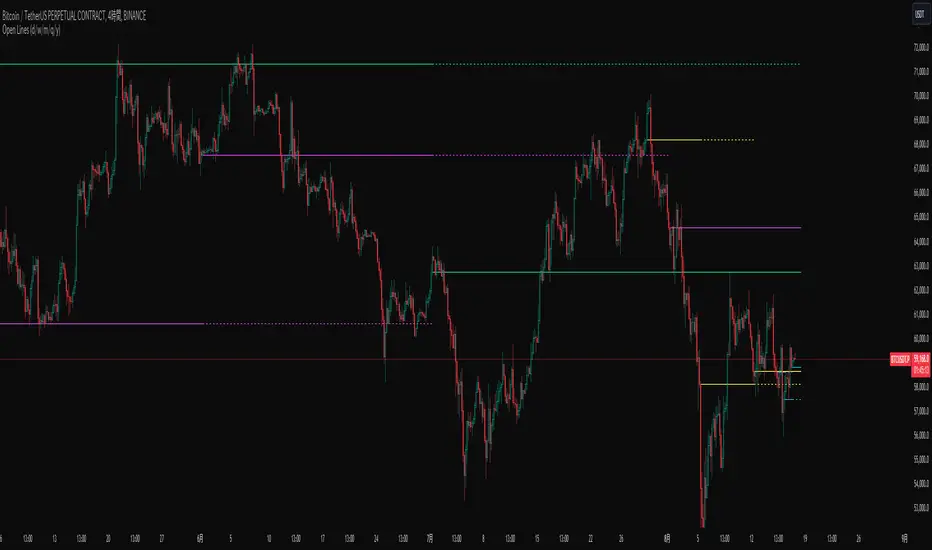
This script draws horizontal lines based on the opening prices of daily, weekly, monthly, quarterly, and yearly candles. A unique feature of this script is the ability to overlay lines from previous periods onto the current period. For example, it can draw the opening price line of the current month as well as the line from the previous month. This allows you to observe not only the battle between bullish and bearish candles of the current period but also the battle over whether the current candle engulfs the previous candle.
Settings
1. Common Settings for Daily to Yearly
Typically, an Extend value of 1 is sufficient, but you can increase this value if you want to observe engulfing patterns spanning multiple periods.
2. Style Settings
To differentiate between the current and past lines, the following settings are available:
Available styles are as follows:
3. Other Settings
This script draws horizontal lines based on the opening prices of daily, weekly, monthly, quarterly, and yearly candles. A unique feature of this script is the ability to overlay lines from previous periods onto the current period. For example, it can draw the opening price line of the current month as well as the line from the previous month. This allows you to observe not only the battle between bullish and bearish candles of the current period but also the battle over whether the current candle engulfs the previous candle.
Settings
1. Common Settings for Daily to Yearly
- On: Toggles the line drawing ON/OFF.
- Line: Sets how many periods back the line should be drawn from the current period.
- Extend: Sets how many periods into the future the lines from past candles should be extended.
Typically, an Extend value of 1 is sufficient, but you can increase this value if you want to observe engulfing patterns spanning multiple periods.
2. Style Settings
To differentiate between the current and past lines, the following settings are available:
- Current session line style: Sets the style for the line representing the opening price of the current candle.
- Next session line style: Sets the style for the line representing the opening price of past candles.
Available styles are as follows:
- sol: solid line
- dsh: dashed line
- dot: dotted line
3. Other Settings
- Allow overlapping of different session lines: By default, this setting prevents overlapping lines when candles from different periods open at the same time. Enabling this option allows lines from different periods, such as quarterly and monthly, to be drawn simultaneously if they overlap. By default, only the lines from the higher time frame are drawn.
Versionshinweise
Two new features have been added to enhance functionality:1. Session-based Line Drawing:
- You can now draw lines based on the opening price of any specified intraday session.
2. Labels:
- Labels are now drawn at each opening price.
- These labels are aligned to the right side of the screen.
Versionshinweise
Adjusting input propertiesOpen-source Skript
Ganz im Sinne von TradingView hat dieser Autor sein/ihr Script als Open-Source veröffentlicht. Auf diese Weise können nun auch andere Trader das Script rezensieren und die Funktionalität überprüfen. Vielen Dank an den Autor! Sie können das Script kostenlos verwenden, aber eine Wiederveröffentlichung des Codes unterliegt unseren Hausregeln.
Haftungsausschluss
Die Informationen und Veröffentlichungen sind nicht als Finanz-, Anlage-, Handels- oder andere Arten von Ratschlägen oder Empfehlungen gedacht, die von TradingView bereitgestellt oder gebilligt werden, und stellen diese nicht dar. Lesen Sie mehr in den Nutzungsbedingungen.
Open-source Skript
Ganz im Sinne von TradingView hat dieser Autor sein/ihr Script als Open-Source veröffentlicht. Auf diese Weise können nun auch andere Trader das Script rezensieren und die Funktionalität überprüfen. Vielen Dank an den Autor! Sie können das Script kostenlos verwenden, aber eine Wiederveröffentlichung des Codes unterliegt unseren Hausregeln.
Haftungsausschluss
Die Informationen und Veröffentlichungen sind nicht als Finanz-, Anlage-, Handels- oder andere Arten von Ratschlägen oder Empfehlungen gedacht, die von TradingView bereitgestellt oder gebilligt werden, und stellen diese nicht dar. Lesen Sie mehr in den Nutzungsbedingungen.