OPEN-SOURCE SCRIPT
Aktualisiert MTF Charting
Key Features
Visual Settings: The script allows customization of the visual aspects of the candlesticks. Traders can select colors for the bodies, borders, and wicks of bullish (rising) and bearish (falling) candles. This customization enhances readability and personal preference alignment.
Examples
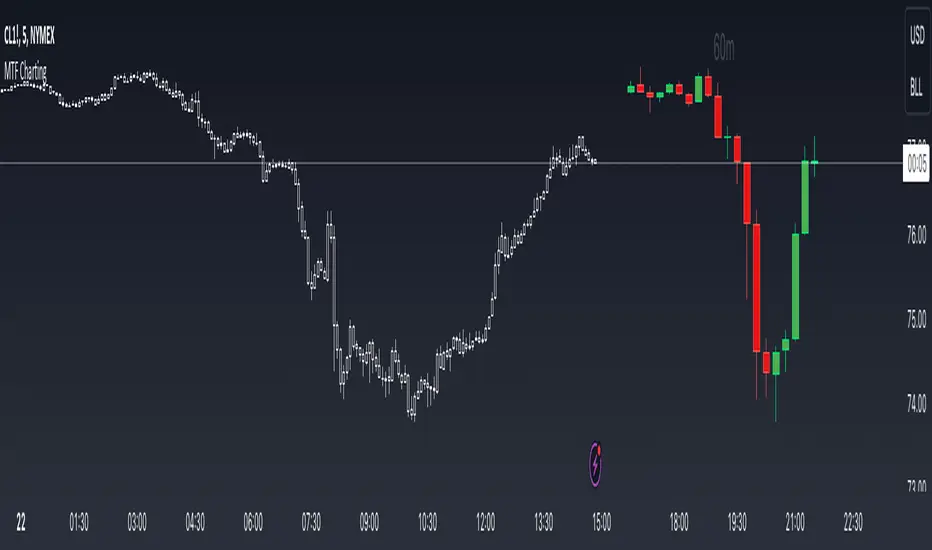
- Display up to 5 timeframes on your main price chart. You are able to get a zoomed out view of the market without taking up too much screen real estate.

- Show a lower timeframe on your primary chart. In this instance maybe you primarily look at the 5 minute chart, but like to refine your entries on the 1 minute. Here you can do it with one chart.

- Look at how the daily candle is forming relative to the timeframe that you are currently on. You can more easily spot where price closed and opened on certain days.

Visual Settings: The script allows customization of the visual aspects of the candlesticks. Traders can select colors for the bodies, borders, and wicks of bullish (rising) and bearish (falling) candles. This customization enhances readability and personal preference alignment.
- Timeframe Settings: Traders can choose up to five different timeframes (labeled as HTF 1 to HTF 5) to display on the main chart. For each selected timeframe, traders can specify the number of candlesticks (bars) to display.
- Candlestick Representation: The script redraws the candlesticks from the selected timeframes onto the main chart. This redrawing includes the high, low, opening, and closing prices of the candlesticks for each timeframe, providing a multi-dimensional view of market trends.
- Labeling: The script includes an option to label each set of candlesticks with their respective timeframe for easy identification.
- Practical Usage for Traders
Market Analysis: By displaying candlesticks from different timeframes, traders can analyze the market more comprehensively. For instance, while the main chart might show a short-term trend, the MTF charting can reveal a different longer-term trend, aiding in more informed decision-making. - Trend Confirmation: Viewing multiple timeframes simultaneously helps in confirming trends. If multiple timeframes show a similar trend, it might indicate a stronger, more reliable trend.
- Identifying Reversals: The script can be useful in spotting potential trend reversals. For example, if the lower timeframe shows a bearish trend while the higher timeframe remains bullish, it might signal a potential reversal.
- Customization for Strategy Alignment: Traders can customize the timeframes and the number of bars to align with their specific trading strategies, whether they are short-term day traders or long-term position traders.
- Technical Aspects
The script uses arrays to store and manipulate candlestick data for each timeframe. This approach ensures efficient handling of data and updates.
Examples
- Display up to 5 timeframes on your main price chart. You are able to get a zoomed out view of the market without taking up too much screen real estate.
- Show a lower timeframe on your primary chart. In this instance maybe you primarily look at the 5 minute chart, but like to refine your entries on the 1 minute. Here you can do it with one chart.
- Look at how the daily candle is forming relative to the timeframe that you are currently on. You can more easily spot where price closed and opened on certain days.
Versionshinweise
Remove leftover code commentsOpen-source Skript
Ganz im Sinne von TradingView hat dieser Autor sein/ihr Script als Open-Source veröffentlicht. Auf diese Weise können nun auch andere Trader das Script rezensieren und die Funktionalität überprüfen. Vielen Dank an den Autor! Sie können das Script kostenlos verwenden, aber eine Wiederveröffentlichung des Codes unterliegt unseren Hausregeln.
Haftungsausschluss
Die Informationen und Veröffentlichungen sind nicht als Finanz-, Anlage-, Handels- oder andere Arten von Ratschlägen oder Empfehlungen gedacht, die von TradingView bereitgestellt oder gebilligt werden, und stellen diese nicht dar. Lesen Sie mehr in den Nutzungsbedingungen.
Open-source Skript
Ganz im Sinne von TradingView hat dieser Autor sein/ihr Script als Open-Source veröffentlicht. Auf diese Weise können nun auch andere Trader das Script rezensieren und die Funktionalität überprüfen. Vielen Dank an den Autor! Sie können das Script kostenlos verwenden, aber eine Wiederveröffentlichung des Codes unterliegt unseren Hausregeln.
Haftungsausschluss
Die Informationen und Veröffentlichungen sind nicht als Finanz-, Anlage-, Handels- oder andere Arten von Ratschlägen oder Empfehlungen gedacht, die von TradingView bereitgestellt oder gebilligt werden, und stellen diese nicht dar. Lesen Sie mehr in den Nutzungsbedingungen.