OPEN-SOURCE SCRIPT
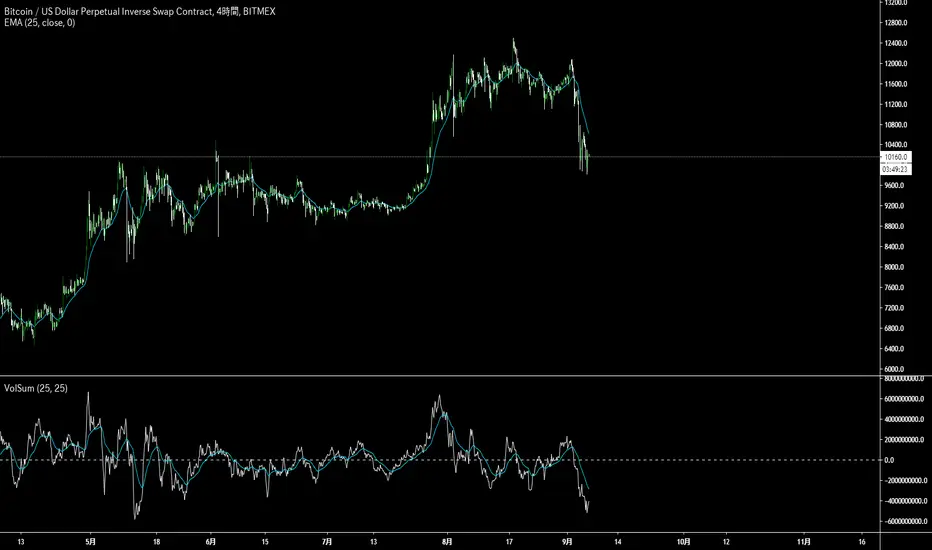
VolSum

Google Translation------------------------------------------------------------------------------------------------------------------------------------------
If the closing price is higher than the opening price, the volume is positive and reverse.
If the closing price is smaller than the opening price, the volume is negative and their defined period
It is an indicator that I thought that I would like to see how the shape changes compared to the price chart
when the sum of is calculated.
The white line is the sum of the output and the light blue line is the white line ema.
日本語---------------------------------------------------------------------------------------------------------------------------------------------------------
終値が始値より大きければ出来高をプラスに逆である終値が始値より小さければ出来高をマイナスにしそれらの定められた期間
の合計(sum)を出したら価格チャートと比較して形がどのように変化するか見てみたいと思い作ったインジケーターです。
白い線が出来高のsumで水色の線は白い線のemaになります。
Open-source Skript
Ganz im Sinne von TradingView hat dieser Autor sein/ihr Script als Open-Source veröffentlicht. Auf diese Weise können nun auch andere Trader das Script rezensieren und die Funktionalität überprüfen. Vielen Dank an den Autor! Sie können das Script kostenlos verwenden, aber eine Wiederveröffentlichung des Codes unterliegt unseren Hausregeln.
Haftungsausschluss
Die Informationen und Veröffentlichungen sind nicht als Finanz-, Anlage-, Handels- oder andere Arten von Ratschlägen oder Empfehlungen gedacht, die von TradingView bereitgestellt oder gebilligt werden, und stellen diese nicht dar. Lesen Sie mehr in den Nutzungsbedingungen.