OPEN-SOURCE SCRIPT
ayogetit Trades™ Dynamic 5DMA
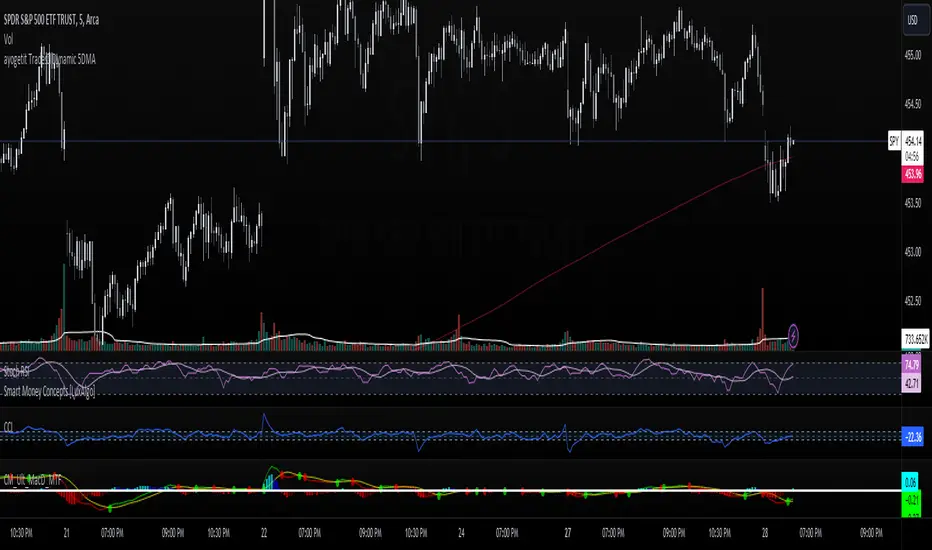
The Dynamic 5-Day Moving Average (MA) indicator is designed to provide traders with a consistent, time-adjusted moving average line across various timeframes. This indicator is especially useful for traders who switch between multiple timeframes and want a moving average that represents a fixed 5-day period, ensuring that the MA reflects a consistent lookback period relative to the amount of trading time each candle represents.
Features:
Timeframe Adaptability: Automatically adjusts the MA period to correspond to a 5-day lookback, regardless of the selected timeframe.
Intraday Precision: For intraday charts (5m, 15m, 30m, 1h, 2h, 4h), the indicator calculates the number of periods within the 5-day span based on the chart's timeframe.
Daily and Weekly Timeframe Compatibility: Sets the period to 5 for daily charts to maintain the 5-day MA, and to 1 for weekly charts, where each candlestick represents a week's worth of trading days.
Calculation Logic:
The indicator begins by defining the total number of trading minutes in 5 days, based on a standard 6.5-hour trading day.
A dynamic period calculation function then determines the number of those intervals that fit into the 5-day minute total for the selected timeframe.
For daily charts, the period is a straightforward 5, while for weekly charts, the period is set to 1, reflecting the average of the past 5 trading days.
Open-source Skript
Ganz im Sinne von TradingView hat dieser Autor sein/ihr Script als Open-Source veröffentlicht. Auf diese Weise können nun auch andere Trader das Script rezensieren und die Funktionalität überprüfen. Vielen Dank an den Autor! Sie können das Script kostenlos verwenden, aber eine Wiederveröffentlichung des Codes unterliegt unseren Hausregeln.
Haftungsausschluss
Die Informationen und Veröffentlichungen sind nicht als Finanz-, Anlage-, Handels- oder andere Arten von Ratschlägen oder Empfehlungen gedacht, die von TradingView bereitgestellt oder gebilligt werden, und stellen diese nicht dar. Lesen Sie mehr in den Nutzungsbedingungen.