PROTECTED SOURCE SCRIPT
Bitcoin long term trends
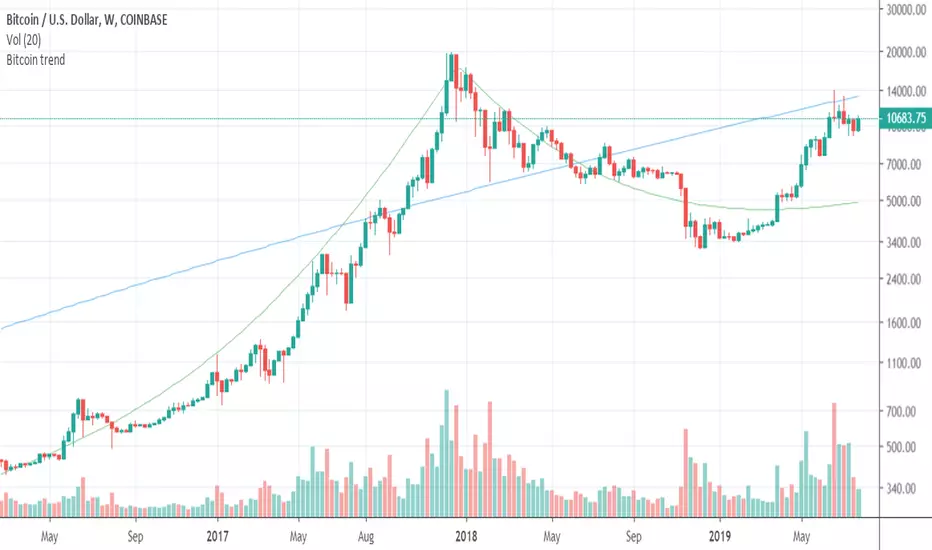
This script shows the long term trends in Bitcoin price.
It is based on my mathematical formula for the long term trends.
The blue line is a long term trend as a power function B = (t/693)^5.526
And the green line is a more sophisticated trend, which models the wave behavior over the whole history of bitcoin.
This script is only applicable to BTCUSD price. The trend lines are calculated as the functions of time only.
 BTCUSD
It is based on my mathematical formula for the long term trends.
The blue line is a long term trend as a power function B = (t/693)^5.526
And the green line is a more sophisticated trend, which models the wave behavior over the whole history of bitcoin.
This script is only applicable to BTCUSD price. The trend lines are calculated as the functions of time only.
Geschütztes Skript
Dieses Script ist als Closed-Source veröffentlicht. Sie können es kostenlos und ohne Einschränkungen verwenden – erfahren Sie hier mehr.
Haftungsausschluss
Die Informationen und Veröffentlichungen sind nicht als Finanz-, Anlage-, Handels- oder andere Arten von Ratschlägen oder Empfehlungen gedacht, die von TradingView bereitgestellt oder gebilligt werden, und stellen diese nicht dar. Lesen Sie mehr in den Nutzungsbedingungen.