OPEN-SOURCE SCRIPT
Close Price - EMA Percentage Difference
Title: Close Price - EMA Percentage Difference Indicator
Description:
The Close Price - EMA Percentage Difference Indicator is an essential tool designed to calculate and display the percentage difference between the closing price of a security and its Exponential Moving Average (EMA). This indicator is particularly useful for traders and analysts who want to understand how far the current price is from its EMA, providing insights into potential price trends and reversals.
Key Features:
Customizable EMA Period: Easily adjust the EMA period to match your trading strategy. Whether you're focusing on short-term trends with a 20-period EMA or analyzing long-term trends with a 200-period EMA, this indicator is flexible to suit your needs.
Percentage Difference Calculation: The indicator computes the percentage difference between the closing price and the selected EMA, allowing you to see how much the current price deviates from its moving average in percentage terms. This calculation helps in identifying potential buying or selling opportunities based on price movements relative to the EMA.
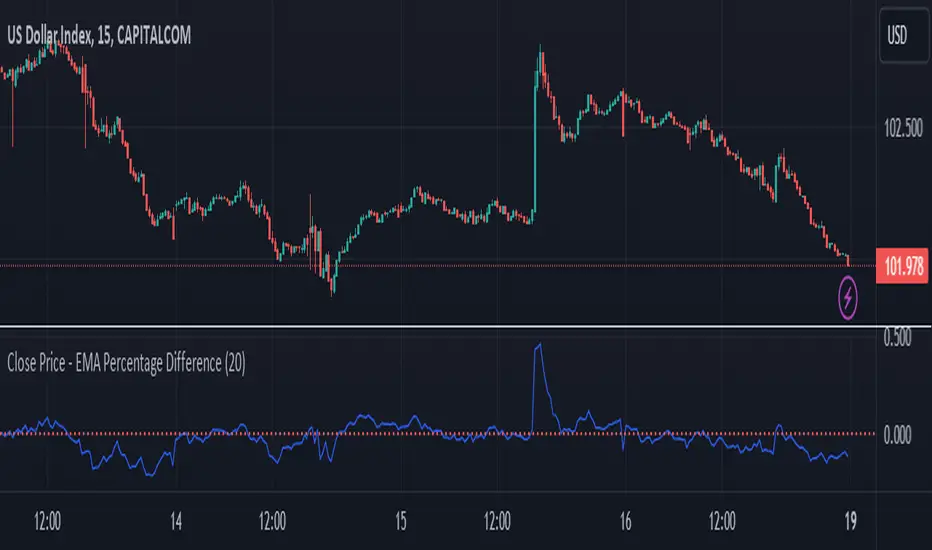
Zero Line Reference: A dotted red line at the zero level is included for quick visual reference. This line helps you instantly identify when the closing price is equal to the EMA, and whether the price is above or below the EMA.
Visual Representation: The percentage difference is plotted on a separate panel below the price chart, providing a clear and intuitive visualization that aids in decision-making.
How to Use:
Adjust the EMA period to fit your analysis or trading strategy.
Observe the percentage difference to understand the strength of the current price in relation to the EMA.
Use the zero line as a reference point to determine whether the price is above (positive values) or below (negative values) the EMA, which can help in identifying overbought or oversold conditions.
This indicator is suitable for all types of traders, from day traders to long-term investors, offering valuable insights into the price dynamics relative to the EMA.
Open-source Skript
Ganz im Sinne von TradingView hat dieser Autor sein/ihr Script als Open-Source veröffentlicht. Auf diese Weise können nun auch andere Trader das Script rezensieren und die Funktionalität überprüfen. Vielen Dank an den Autor! Sie können das Script kostenlos verwenden, aber eine Wiederveröffentlichung des Codes unterliegt unseren Hausregeln.
Haftungsausschluss
Die Informationen und Veröffentlichungen sind nicht als Finanz-, Anlage-, Handels- oder andere Arten von Ratschlägen oder Empfehlungen gedacht, die von TradingView bereitgestellt oder gebilligt werden, und stellen diese nicht dar. Lesen Sie mehr in den Nutzungsbedingungen.