OPEN-SOURCE SCRIPT
Aktualisiert Trend identifier with signals - Swing Trading
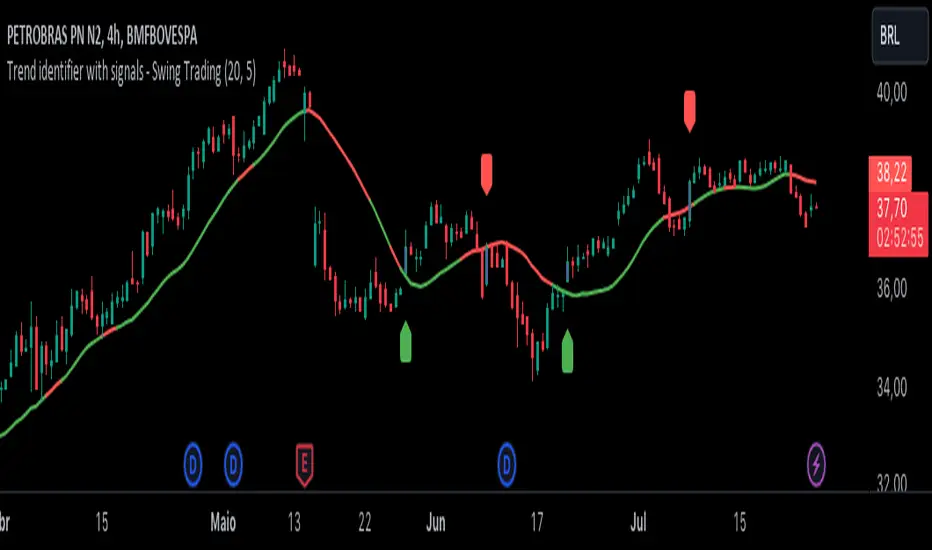
Indicator Objective
The "Trend identifier with signals - Swing Trading" indicator is designed to help traders identify market trends and provide clear visual signals for potential buy and sell points based on the interaction of price with the 20-period moving average.
How the Indicator Works
20-Period Moving Average:
The indicator calculates the 20-period simple moving average (SMA), which is a common tool for smoothing out price fluctuations and identifying the overall market direction.
The moving average is plotted on the chart, changing color according to the identified trend:
Green: Indicates an uptrend.
Red: Indicates a downtrend.
Gray: Indicates a neutral or undefined market condition.
Trend Identification on the Daily Chart:
The indicator checks the trend based on an adjustable period (default is 5 periods):
Uptrend: When the short-term moving average (5 periods) is above the long-term moving average (10 periods).
Downtrend: When the short-term moving average (5 periods) is below the long-term moving average (10 periods).
Signal for Touching the Moving Average:
When the price crosses the 20-period moving average, the candles are colored purple to indicate that there was a touch on the moving average.
This helps identify critical points where the price may reverse or continue its trend.
Trend Signal:
Green Flag: Appears below the candle when there is a touch on the moving average and the trend is up, suggesting a potential buy point.
Red Flag: Appears above the candle when there is a touch on the moving average and the trend is down, suggesting a potential sell point.
Lateral Zone Identification:
The indicator also checks if the price touched the moving average for 5 consecutive candles, indicating a possible consolidation or lateral zone.
If this occurs, a message "Possible Lateral Zone" is shown on the chart, helping the trader avoid trades in a market without a clear direction.
How the Indicator Helps Traders
Clear Trend Identification:
By changing the color of the moving average according to the trend (green for up, red for down), the indicator provides a clear visualization of market direction.
This allows traders to align their trades with the prevailing trend, increasing the probability of success.
Visual Buy and Sell Signals:
The green and red flags provide direct visual signals for potential entry and exit points, based on the interaction of price with the moving average.
This is particularly useful for novice traders who may struggle to identify these points on their own.
Risk Management and Trade Planning:
Identifying lateral zones helps traders avoid trading in trendless markets, where price movements are more unpredictable.
This improves risk management and allows traders to focus on more favorable opportunities.
Versionshinweise
code is subjectOpen-source Skript
Ganz im Sinne von TradingView hat dieser Autor sein/ihr Script als Open-Source veröffentlicht. Auf diese Weise können nun auch andere Trader das Script rezensieren und die Funktionalität überprüfen. Vielen Dank an den Autor! Sie können das Script kostenlos verwenden, aber eine Wiederveröffentlichung des Codes unterliegt unseren Hausregeln.
Haftungsausschluss
Die Informationen und Veröffentlichungen sind nicht als Finanz-, Anlage-, Handels- oder andere Arten von Ratschlägen oder Empfehlungen gedacht, die von TradingView bereitgestellt oder gebilligt werden, und stellen diese nicht dar. Lesen Sie mehr in den Nutzungsbedingungen.
Open-source Skript
Ganz im Sinne von TradingView hat dieser Autor sein/ihr Script als Open-Source veröffentlicht. Auf diese Weise können nun auch andere Trader das Script rezensieren und die Funktionalität überprüfen. Vielen Dank an den Autor! Sie können das Script kostenlos verwenden, aber eine Wiederveröffentlichung des Codes unterliegt unseren Hausregeln.
Haftungsausschluss
Die Informationen und Veröffentlichungen sind nicht als Finanz-, Anlage-, Handels- oder andere Arten von Ratschlägen oder Empfehlungen gedacht, die von TradingView bereitgestellt oder gebilligt werden, und stellen diese nicht dar. Lesen Sie mehr in den Nutzungsbedingungen.