OPEN-SOURCE SCRIPT
Aktualisiert [MACC] Moving Average Candle Color
The simplest trading framework is using moving average. This indicator is harnessing that very method.
What It Does:
This indicator helps you see market trends at a glance by changing the color of the candlesticks based on the relationship between two Exponential Moving Averages (EMAs). When the 9-period EMA is above the 21-period EMA, candlesticks turn green, suggesting a bullish trend. When the 9 EMA is below the 21 EMA, candlesticks turn red, indicating a bearish trend.
Why You'll Love It:
Easy Trend Visualization: Quickly spot trends and potential reversals with color-coded candlesticks.
Customizable Settings: Adjust the lengths of the EMAs to fit your trading style. Just change the values in the settings panel and watch the indicator update in real-time.
Optional EMA Lines: See the EMA lines plotted on your chart for added context and trend confirmation.
How to Use It:
Green Candlesticks: It’s a sign that the trend is likely upward.
Red Candlesticks: signaling a potential downward trend.
Customization:
EMA Lengths: You can set the lengths for the 9 EMA and 21 EMA to whatever fits your trading strategy best.
Colors: Adjust the colors if you want to match your chart’s theme.
Get Started: Add this indicator to your TradingView chart and tweak the settings to see how it helps you track market trends more effectively.
Cherio...
Versionshinweise
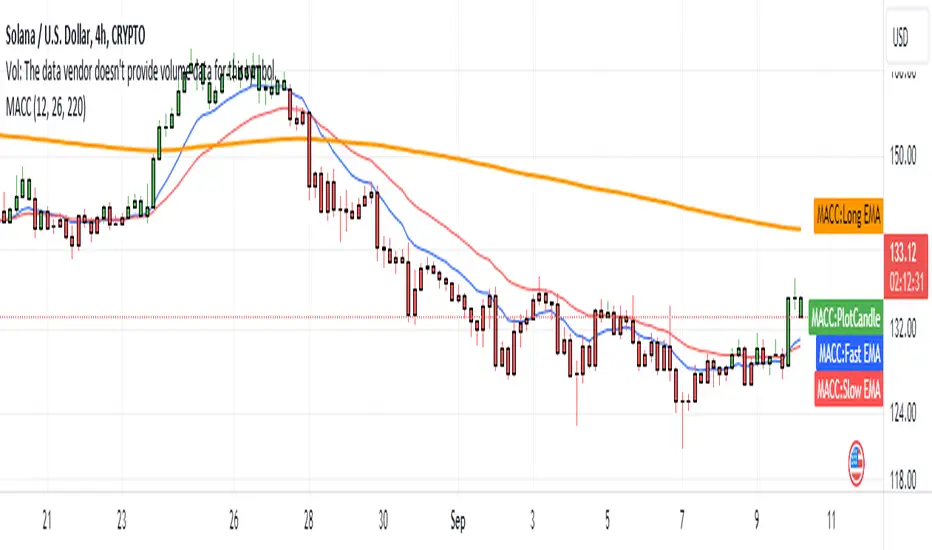
This one is still leveraging the humble moving averages indicator, but this updated version also consider the price action itself to color the candle.Reading this indicator is simple, green means bullish & red means bearish. This can be combined with looking at the EMAs itself to consider taking any trading position.
Because the indicator is coloring the candle, there must be small modification on the standard settings. Go to settings, then go to symbol section, and uncheck the coloring for candle Body, Borders, and Wick.
Cherio...
Versionshinweise
Minor update in allert.Cherio...
Open-source Skript
Ganz im Sinne von TradingView hat dieser Autor sein/ihr Script als Open-Source veröffentlicht. Auf diese Weise können nun auch andere Trader das Script rezensieren und die Funktionalität überprüfen. Vielen Dank an den Autor! Sie können das Script kostenlos verwenden, aber eine Wiederveröffentlichung des Codes unterliegt unseren Hausregeln.
Haftungsausschluss
Die Informationen und Veröffentlichungen sind nicht als Finanz-, Anlage-, Handels- oder andere Arten von Ratschlägen oder Empfehlungen gedacht, die von TradingView bereitgestellt oder gebilligt werden, und stellen diese nicht dar. Lesen Sie mehr in den Nutzungsbedingungen.