OPEN-SOURCE SCRIPT
Aktualisiert Market Snapshot
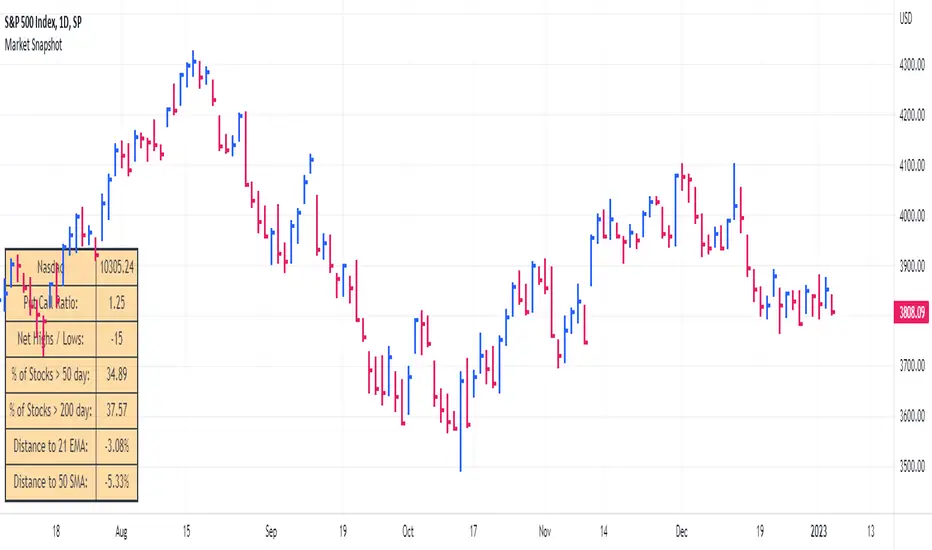
Get a snapshot of the market with the index's last price, distance to selectable moving averages, and breadth data.
Choose to see data based on the Nasdaq or SPX, as well as net highs / lows for the Nasdaq, NYSE or combined.
Snapshot shows:
- Index's (SPX or Nasdaq's) last price
- Put call ratio
- % of stocks above the 50 day moving average for the index of your choice
- % of stocks above the 200 day moving average for the index of your choice
- Distance to or from two selectable moving averages. (negative number means price is below the moving average, positive means price is above)
Configurable options:
- Which moving averages to use
- Where to display the table on your chart
- Table size, background and text colors
Versionshinweise
fixed table sizing Versionshinweise
bug fixOpen-source Skript
Ganz im Sinne von TradingView hat dieser Autor sein/ihr Script als Open-Source veröffentlicht. Auf diese Weise können nun auch andere Trader das Script rezensieren und die Funktionalität überprüfen. Vielen Dank an den Autor! Sie können das Script kostenlos verwenden, aber eine Wiederveröffentlichung des Codes unterliegt unseren Hausregeln.
Trusted Pine programmer. Send me a message for script development.
Haftungsausschluss
Die Informationen und Veröffentlichungen sind nicht als Finanz-, Anlage-, Handels- oder andere Arten von Ratschlägen oder Empfehlungen gedacht, die von TradingView bereitgestellt oder gebilligt werden, und stellen diese nicht dar. Lesen Sie mehr in den Nutzungsbedingungen.
Open-source Skript
Ganz im Sinne von TradingView hat dieser Autor sein/ihr Script als Open-Source veröffentlicht. Auf diese Weise können nun auch andere Trader das Script rezensieren und die Funktionalität überprüfen. Vielen Dank an den Autor! Sie können das Script kostenlos verwenden, aber eine Wiederveröffentlichung des Codes unterliegt unseren Hausregeln.
Trusted Pine programmer. Send me a message for script development.
Haftungsausschluss
Die Informationen und Veröffentlichungen sind nicht als Finanz-, Anlage-, Handels- oder andere Arten von Ratschlägen oder Empfehlungen gedacht, die von TradingView bereitgestellt oder gebilligt werden, und stellen diese nicht dar. Lesen Sie mehr in den Nutzungsbedingungen.