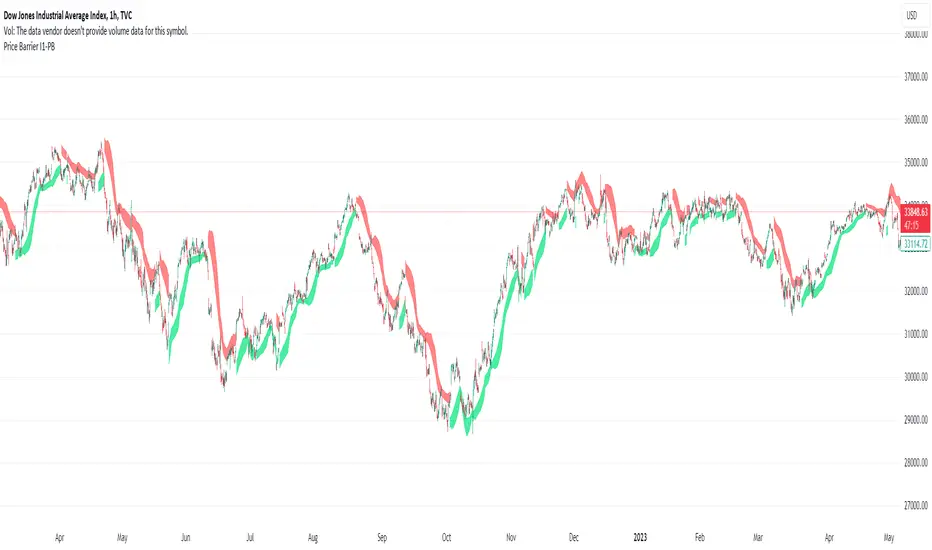
Price Barrier I1-PB
This script combines: Parabolic SAR, Stochastic RSI and MA
SAR is used to determine the price direction of an asset, as well as draw attention to when the price direction is changing.
Combine Stochastic RSI to point out the strength of the SAR signals.(Of course the setting for Stochastic RSI in this script is customized).
Then using MA to calculate and plot.
The plot line of this script at the center line and draw 2 line with offset to the center line.
Concept:
(Note that we take the close to get the closing price)
-SAR provides series of dots placed either above or below the price bars. A dot below the price is deemed to be a bullish signal.
-Stochastic RSI with its crossing of K and D line, last crossing of K and D will be recognized as crossing point. The direction of latest points will be current trend also in some case value above 80 is Over Buy and below 20 is Over Sell.
-So how could we present the domain line? (The domain line are two line with background color filled) Using the deviation from the MA as the baseline, we will draw two lines with 2 distinct points, then color them. We will call them price barrier. There are 4 plot MA, 2 for above and 2 for below.
-Strength of barrier calculation based on SAR and RSI mentioned above.
How it works:
1. The price barrier (domain line) displays above and below bar which could be resistance or support for current bar.
- Yellow means the soon/week signal.
- Green below bar means the support barrier.
- Red above bar mean the resistance barrier.
2. This indicator provides a warning signal when the color of the price barrier changes.
- Above barrier's color:
+Turn red: "Down Red"
+Turn yellow: "Down Yellow"
- Below barrier's color:
+Turn green: "Up Green"
+Turn yellow: "Up Yellow"
Suitable time frames:
4h, 1D, 1W
* Please note that this logic does not attempt to predict future prices or 100% accurate signal.
(INVITE ONLY indicator. Please direct message or visit website if you want to try it out)
Hope you guys enjoy!
Examples:
BTCUSD 4H
XAUUSD 1D
EURUSD 1D
AAPL 1D
- Change barriers resolution.
- Remove yellow color and refactor code to add in BBoard.
- Change alert message with "Support" and "Resistance" .
Skript nur auf Einladung
Ausschließlich Nutzer mit einer Erlaubnis des Autors können Zugriff auf dieses Script erhalten. Sie müssen diese Genehmigung bei dem Autor beantragen. Dies umfasst üblicherweise auch eine Zahlung. Wenn Sie mehr erfahren möchten, dann sehen Sie sich unten die Anweisungen des Autors an oder kontaktieren Sie albedor direkt.
TradingView empfiehlt NICHT, für die Nutzung eines Scripts zu bezahlen, wenn Sie den Autor nicht als vertrauenswürdig halten und verstehen, wie das Script funktioniert. Sie können außerdem auch kostenlose Open-Source-Alternativen in unseren Community-Scripts finden.
Hinweise des Autors
Haftungsausschluss
Skript nur auf Einladung
Ausschließlich Nutzer mit einer Erlaubnis des Autors können Zugriff auf dieses Script erhalten. Sie müssen diese Genehmigung bei dem Autor beantragen. Dies umfasst üblicherweise auch eine Zahlung. Wenn Sie mehr erfahren möchten, dann sehen Sie sich unten die Anweisungen des Autors an oder kontaktieren Sie albedor direkt.
TradingView empfiehlt NICHT, für die Nutzung eines Scripts zu bezahlen, wenn Sie den Autor nicht als vertrauenswürdig halten und verstehen, wie das Script funktioniert. Sie können außerdem auch kostenlose Open-Source-Alternativen in unseren Community-Scripts finden.